Citrix · Software · YoctoIT tech page

Monitor

Director and the platform analytics: the experience's thermometer and the real-time diagnosis — helpdesk included.

FOCUS · THE PLATFORM'S PULSESessions, failures and trends in one console: the helpdesk that solves at the first call
YoctoIT material for clients and partners · Citrix, NetScaler, HDX and the other products mentioned are trademarks of Cloud Software Group, Inc.
01 · What it is

Monitor & Analytics, made clear.

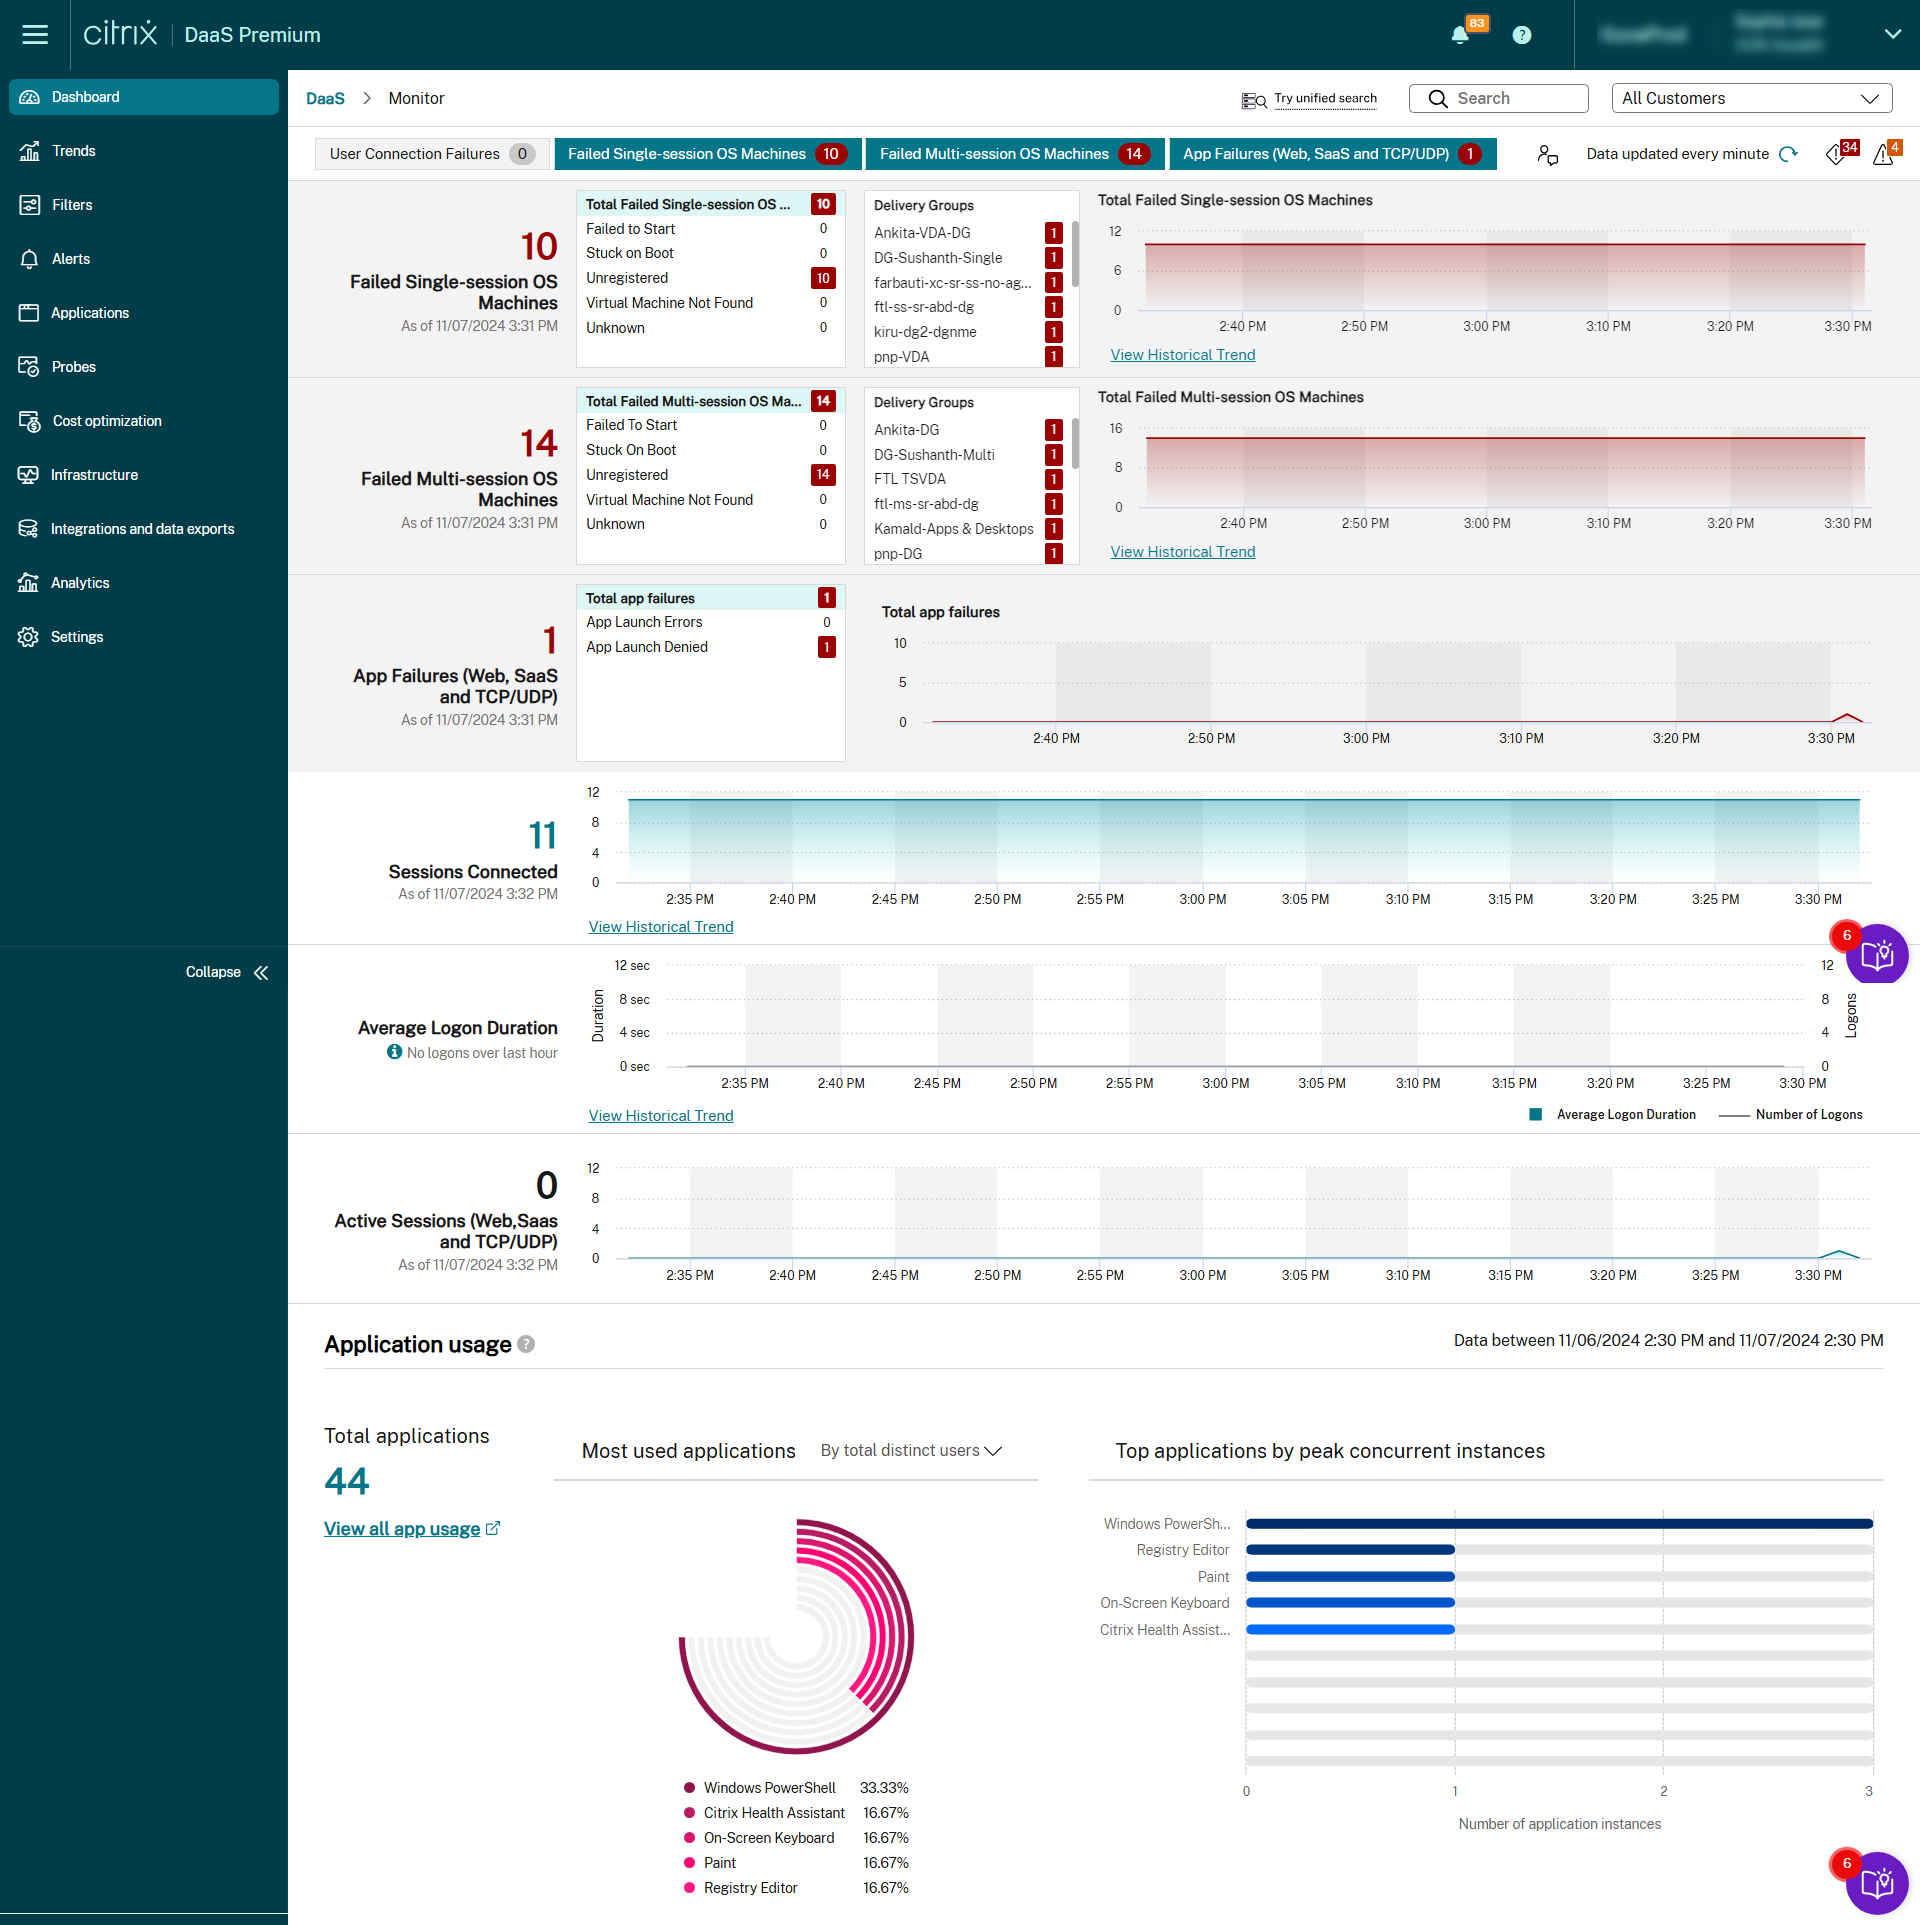
Monitor (Director) is the workspace's operational console: the live sessions with their health, the logons over time, the failures with the cause, and the helpdesk tools — session shadowing, profile reset, messages to the user. The analytics add the trends: the platform read today and over time.

Live
every session: state, latency, resources — as it happens
Shadow
the helpdesk enters (authorized) the session: it sees what the user sees
Trend
logons, failures and capacity over time: the historical thermometer
Monitor & Analytics
OFFICIAL CITRIX BRANDING · MONITOR
CONSOLE REALE · DIRECTOR DASHBOARD · FONTE: CITRIX DOCS
REAL CONSOLE · DIRECTOR DASHBOARD · SOURCE: CITRIX DOCS
02 · How to use it well

The things that make the difference.

The console

Helpdesk & operationsthose who answer the phone
Live sessions
Failures & causes
Trends & reports
now · why · over time
Actions: shadow, reset, logoffsolve, not just see
Alerts → NOCthe anomaly in the right flow
The platform under control, in one view

Runbooks for the helpdesk

The first three moves for the typical cases: the call solved in one, not escalated in three.

Alerts with our thresholds

Logons over the threshold and the failure rate in our NOC: the degradation seen before the switchboard.

Reports for the management

Monthly usage, experience and capacity: the workspace told to the upper floors.

With uberAgent alongside

Director for the operations, uberAgent for the depth: the complete pair.

03 · In depth

Director: the equipped first-level support

Monitor (Director) is the VDI helpdesk's console: the user search opens the session in real time (logon duration broken into phases, ICA latency, processes), the shadowing assists remotely with consent, the quick actions (logoff, profile reset) solve at first contact; the historical trends (with the Premium license's retention) show capacity and adoption; the proactive alerts flag before they call; the uberAgent integration extends into deep telemetry.

  • Logon duration — the logon's phases broken down: the 'slow this morning' diagnosed
  • Shadowing — the operator sees the session: the problem shown, not narrated
  • Azioni first-call — profile reset, logoff, messages: closed at the first call
  • Trend storici — capacity and usage patterns: the decisions on data
  • Alert proattivi — the thresholds that warn before the users do
  • RBAC helpdesk — the first level with the right powers: neither too many nor too few
04 · Numbers and lifecycle

The numbers that matter.

real-time
the view over the active sessions
-30%
the typical escalation with the first-call actions
90 gg
the historical trends (Premium)
1
one console for the whole session estate
The VDI is judged by its support: Director in our helpdesk — the call solved while the user is on the phone.
05 · Use cases

Where it really pays off.

First-level support

Diagnosis and remedy in the same console.

Platform operations

The VDI managed with the day's numbers.

Reporting

The platform demonstrated, month by month.

VDI is operated with the thermometer in hand: Director is the thermometer — the hand is ours.