KNIME · Software · YoctoIT tech page

Data apps

From the workflows to the interactive applications and the automatic reports: the analysis delivered to those who decide.

FOCUS · THE ANALYSIS DELIVEREDThe workflow becomes a web app: the business explores, without seeing a node
YoctoIT material for clients and partners · KNIME and the products mentioned are trademarks of KNIME AG.
01 · What it is

Data apps & reporting, made clear.

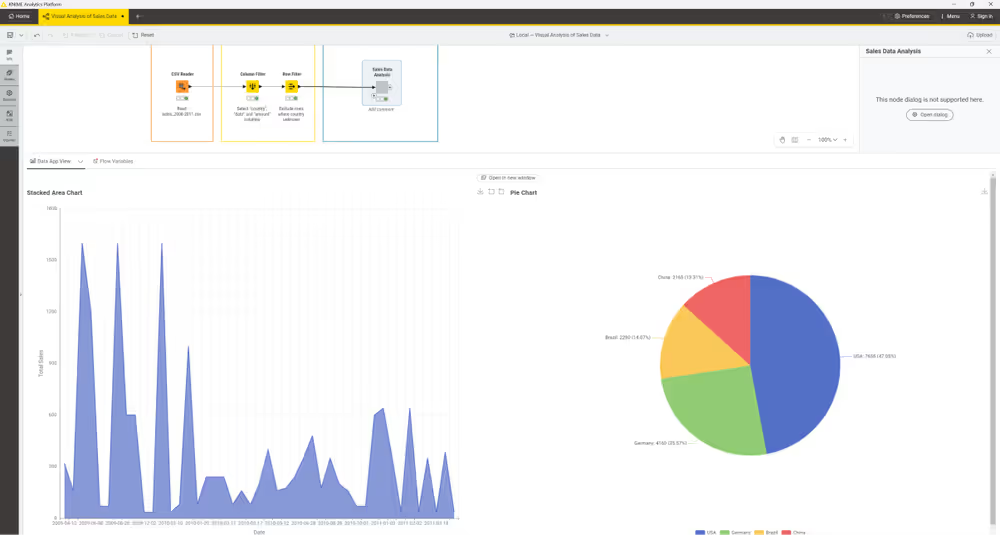
The last mile of the analysis is the delivery: the data apps turn a workflow into a web application — filters, charts, drill-downs — that the business colleague uses from the browser, without knowing what a node is. And the scheduled reporting delivers PDFs and Excels into the right inboxes, every Monday at 7.

Web app
the workflow with an interface: self-service analysis for the business
Schedulati
reports generated and distributed by themselves: Monday at 7, always
Interattivo
filters and drill-downs: the next question without calling the analyst
Data apps & reporting
OFFICIAL KNIME BRANDING · DATA APPS
INTERFACCIA REALE · DATA APP · FONTE: KNIME DOCS
REAL INTERFACE · DATA APP · SOURCE: KNIME DOCS
02 · How to use it well

The things that make the difference.

The last mile

Those who decidemanagement, sales, operations
Data app
PDF/Excel reports
Notifications
explore · receive · react
Hub · deployment & accessesthe governed storefront
The workflows underneaththe invisible factory
From the flow to the decision-maker's browser

The design for the user

Three filters and the right answers: the data app the business uses is the simple one.

Access by role

Each function sees its own numbers: the confidentiality inside the delivery.

The report that arrives

Generation, signing and sending scheduled: the distribution as part of the flow.

Measured adoption

Who uses what: the dead apps get switched off, the living ones improved.

03 · In depth

Interactive analyses without writing a frontend

The Data Apps turn the workflows into web applications: the components with widgets (filters, charts, maps, inputs) compose interactive pages, the business user explores and decides (what-if, drill-down, approvals) without seeing a node, the partial re-execution makes the UI responsive, the Hub's permissions govern who sees what; the typical case: the pricing simulated by sales, the operations' quality control, the CFO's what-if — without frontend development.

  • Widget compositi — filters, charts and inputs combined: the page from the workflow
  • What-if — the parameters moved, the result recomputed: the simulation in the business's hands
  • Re-esecuzione parziale — only the touched branch reruns: the responsive UI
  • Zero frontend — no React nor web deploys: the workflow IS the app
  • Permessi Hub — the app for those who should: the governance included
  • Iterazione rapida — the change to the flow is online right away: the feedback within the day
04 · Numbers and lifecycle

The numbers that matter.

0
lines of frontend written
giorni
from the idea to the app in production
100%
of the logic reused from the analysis workflow
browser
the client: nothing to install
The data's last mile is the interface: data apps instead of static reports — we build them with your analysts.
05 · Use cases

Where it really pays off.

Executive self-service

The frequent questions, solved by an app.

Periodic reporting

The monthly pack produced and sent by itself.

Sharing with the customers

The branded report for the outside, automatic.

The analysis counts when it reaches those who decide: the data apps deliver it — we put them in production.