KNIME · Software · YoctoIT tech page

Analytics Platform

The open-source visual tool: drag-and-drop pipelines from data cleaning to the model — data science without barriers.

FOCUS · VISUAL ANALYSISNodes instead of code: the analysis you can read, explain and hand to colleagues
YoctoIT material for clients and partners · KNIME and the products mentioned are trademarks of KNIME AG.
01 · What it is

KNIME Analytics Platform, made clear.

The Analytics Platform is KNIME's open-source desktop: the analysis flows are BUILT by dragging nodes — read, clean, join, model, visualize — and read like diagrams: the analysis documented by construction. Free and complete: the entrance door to data science for those who don't write code (and an extra gear for those who do).

Open source
the complete desktop, free: you start today, without licenses
Visuale
the flow is visible: the analysis explainable to the colleague and the auditor
4000+
the nodes available: from Excel to deep learning, everything within reach
KNIME Analytics Platform
OFFICIAL KNIME BRANDING · ANALYTICS PLATFORM
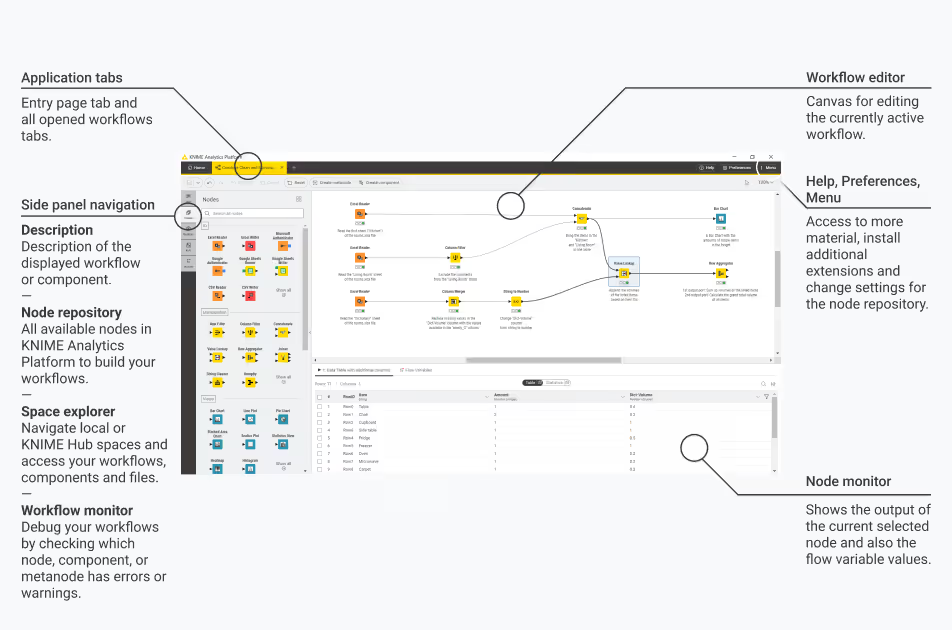
INTERFACCIA REALE · KNIME WORKBENCH · FONTE: KNIME DOCS
REAL INTERFACE · KNIME WORKBENCH · SOURCE: KNIME DOCS
02 · How to use it well

The things that make the difference.

The flow

The business question'why are the returns growing?'
Read & clean
Transform & join
Model & visualize
the stages, visible
The workflow · reusablethe analysis redone in one click
Sharing on the Hubfrom personal to corporate
The analysis as a living diagram

Training that unlocks

Two days of training and the controller builds on their own: the investment that pays back in weeks.

Good practices from the first flows

Naming, annotations and structure: the workflows readable in six months — by others too.

Targeted Excel replacement

The most fragile spreadsheet processes converted first: fewer errors, more traceability.

The scale ready

When the flows count: the Hub industrializes them — the path is already drawn.

03 · In depth

Visual workflows: nodes, flows and reproducibility

KNIME Analytics Platform builds the analysis with nodes: each node does one thing (read, filter, join, model) and the workflow chains them into an executable, inspectable graph — the data gets looked at at every step; the components package reusable logic with an interface, the loops and the flow variables parameterize, the Python/R/Java integration extends where needed; the workflow IS the documentation: whoever comes after understands, the audit retraces.

  • Nodi ispezionabili — the data visible after every step: debugging is looking
  • Componenti — the reusable logic with a UI: the corporate standard encapsulated
  • Flow variable — the parameters that cross the flow: one workflow, a thousand uses
  • Python/R integrati — the script where needed, the visual where it suffices
  • Riproducibilità — same flow, same result: science, not magic
  • Gratis sul desktop — the complete open-source platform: you start today
04 · Numbers and lifecycle

The numbers that matter.

0€
the desktop's cost: complete open source
4500+
the nodes available with the extensions
2/anno
the main releases
100%
of the flow documented by itself: the audit says thanks
Analytical low-code democratizes the data: training, standards and components — the team that analyzes without waiting for IT.
05 · Use cases

Where it really pays off.

Controlling & finance

The reconciliations and the reports, automated.

Quality & operations

The production data analyzed by the process engineers.

Those starting with data

Data science without the wall of code.

Analytical talent is everywhere, code isn't: KNIME brings them together — we speed up the meeting.