Google Cloud · Software · YoctoIT tech page

Looker

Business intelligence on the semantic model: metrics defined once, right for everyone — dashboards included.

FOCUS · A SINGLE TRUTHLookML: 'revenue' defined once, the same in every report
YoctoIT material for clients and partners · Google Cloud, BigQuery, Gemini and the other products mentioned are trademarks of Google LLC.
01 · What it is

Looker, made clear.

Looker is the BI that starts from the model: in LookML metrics and relationships are defined once, versioned as code, and every dashboard, exploration or API uses them identically. Queries run on the warehouse (no aging extracts) and Gemini adds natural-language querying.

LookML
the versioned semantic model: the metric is code, not a hidden formula
In-database
queries run on BigQuery: the data live, never copied
API-first
metrics served to apps and processes too: BI beyond the charts
Looker
OFFICIAL GOOGLE CLOUD BRANDING · LOOKER
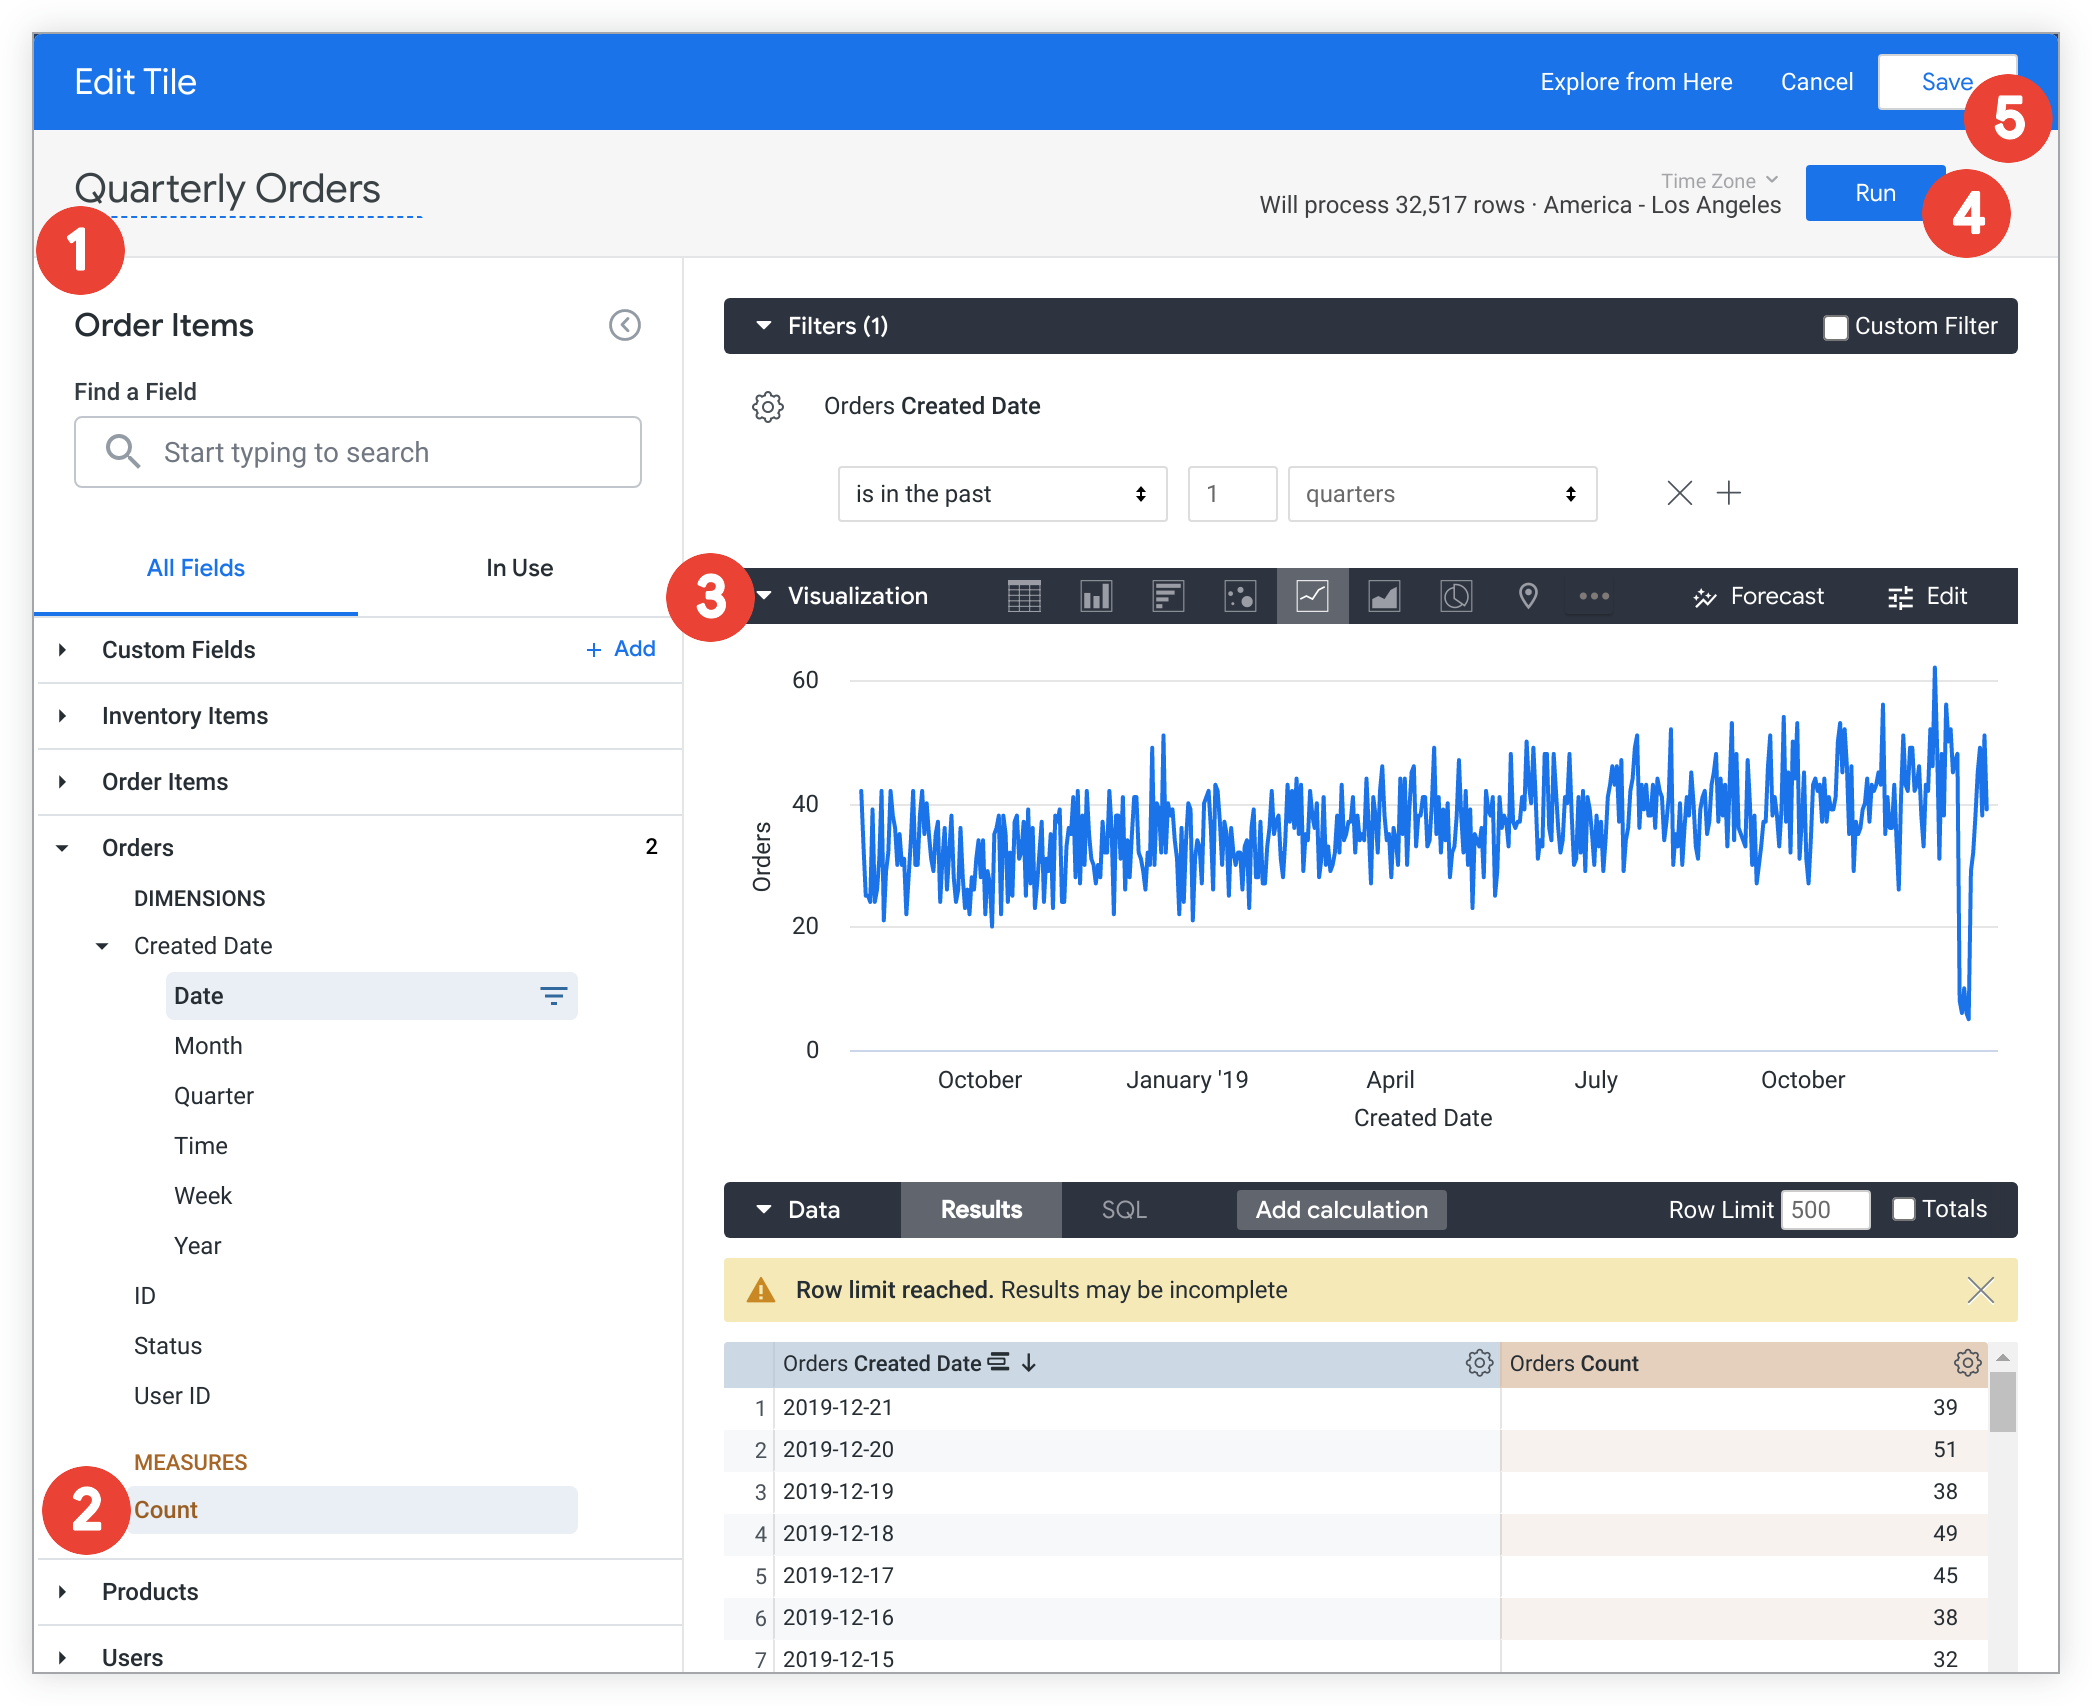
CONSOLE REALE · DASHBOARD LOOKER · FONTE: GOOGLE CLOUD DOCS
REAL CONSOLE · LOOKER DASHBOARD · SOURCE: GOOGLE CLOUD DOCS
02 · How to use it well

The things that make the difference.

L'architettura

Dashboards, explorations, appswho consumes the numbers
LookML · the model
Explore · self-service
Embedded & API
definition · freedom · integration
Git & CI on the modelBI with software practices
BigQuery (and other DWs)the engine underneath
Semantics at the center, the data where it is

The model before the charts

The business entities and metrics modeled in order: the dashboard is the consequence.

Self-service on rails

Users explore freely inside the model: curiosity without diverging numbers.

Metrics in production

Via API, the same metrics feed apps and automations: BI that acts.

Lifecycle governance

Git, reviews and environments: the model evolves without breaking Monday's reports.

03 · In depth

The semantic model: one truth, many surfaces

Looker centralizes the business logic in LookML: metrics and dimensions defined once, versioned in Git, served everywhere — Looker dashboards, Google Sheets (Connected Sheets), APIs, embedded applications. Queries run in-database (BigQuery and beyond): no extracts to synchronize; aggregate awareness speeds things up without duplicating logic; row-level security follows the user on every surface.

  • LookML — metrics as code: Git, reviews and a single definition of 'revenue'
  • In-database — queries on the live warehouse: the data never copied around
  • Aggregate awareness — rollups used on their own when they suffice: speed without duplicates
  • Embedded — dashboards inside your portals with the security that follows
  • Connected Sheets — the business on Google Sheets, but on governed numbers
  • API — every metric queryable via API: BI as a service
04 · Numbers and lifecycle

The numbers that matter.

1
one definition per metric: the end of the three versions of revenue
0
extracts to synchronize: the data stays in the warehouse
Git
the versioned model: BI with the software lifecycle
RLS
per-row security on every surface
Reliable BI starts from the model: LookML, governance and training — self-service BI without anarchy.
05 · Use cases

Where it really pays off.

Reporting direzionale

The board and the controller on the same numbers.

Embedded BI

The dashboards inside your product or customer portal.

Operational metrics

Each department its own view, a single definition.

BI fails when everyone has their own Excel: Looker puts the truth in common.