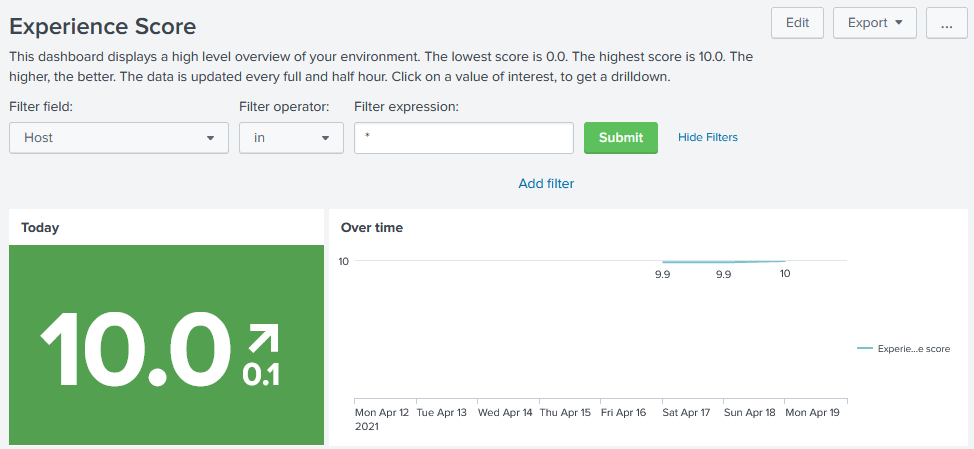
The user experience measured: session performance and security analytics from the inside — the VDI with the user's numbers.
“The desktop is slow” — but where? uberAgent measures it from inside the session: logon times broken down (profile, GPOs, scripts), perceived latency, apps that consume, errors. And on the security front: anomalous processes, use of suspicious tools. The workspace's UX stops being an opinion.


Profile, GPOs, scripts and antivirus timed: the 40 seconds find their culprits.
The density per host tuned on the measured UX, not on the CPU: the right hosts, happy users.
Every new image compared with numbers: the improvement (or the regression) certified.
The uberAgent metrics inside the Yocto Vision flow: the experience among the SLAs.
uberAgent (now in the Citrix Platform License) measures what Director doesn't see: the experience per application (startup times, hangs, crashes, UI delay), the boot and logon detail per phase, the consumption per process (who steals CPU and IOPS), the browser telemetry (slow pages per site), the security (uberAgent ESA: process trees and suspicious activity); the data goes to Splunk/Elastic/Azure Monitor: the dashboards answer 'why is it slow'.
The hunt for seconds, guided by data.
The complaint turned into a precise cause.
The SLA on the UX, truly measured.