AWS · Software · YoctoIT tech page
Observability

AWS's eyes and memory: metrics, logs and alarms with CloudWatch; every API call traced with CloudTrail.

FOCUS · TOTAL VISIBILITYYour AWS footprint inside our NOC: the right alarms, complete audit
YoctoIT material for clients and partners · AWS e i nomi dei servizi sono marchi di Amazon.com, Inc.
01 · What it is

CloudWatch & CloudTrail, made clear.

CloudWatch collects metrics and logs from all services, with dashboards, alarms and queries (Logs Insights). CloudTrail records who did what on the APIs: the basis of audits and investigations. Together they are the cloud's native observability.

Native
every AWS service emits metrics without agents
Alarms
thresholds and anomaly detection: the NOC alerted before the user
100%
of API calls traced: the audit that never forgets
Icona ufficiale AWS — CloudWatch & CloudTrail
OFFICIAL AWS ICON · Observability
Console AWS
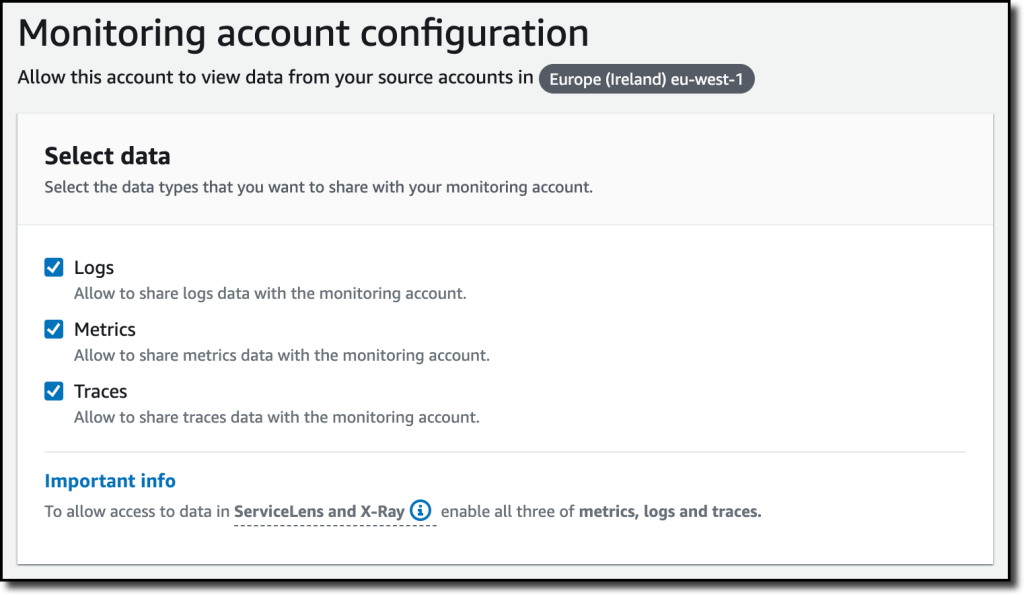
REAL AWS CONSOLE · CLOUDWATCH METRICHE · SOURCE: AWS BLOG
02 · How to use it well

The things that make the difference.

The observability cycle

AWS services & applicationsthe sources
Metrics
Log
Traces (X-Ray)
the three signals
Alarms & dashboardsthe operational reading
CloudTrail + retentionthe memory for audits and forensics
See, understand, prove

Logs Insights

Log queries without an ELK to maintain: answers in seconds during the incident.

Anomaly detection

Thresholds that learn themselves: fewer false alarms, more signal.

Composite alarms

Combined conditions: someone gets woken up only when it's really needed.

Integration with our NOC

CloudWatch alarms inside Yocto Vision: cloud and on-prem, one 24/7 watch.

03 · In depth

Metrics, logs and observability that acts

CloudWatch collects standard and custom metrics (down to 1s resolution), Logs with Insights to query them, simple and composite alarms that reduce noise, cross-account dashboards. On top: ServiceLens with X-Ray for tracing, Synthetics for endpoint canaries, RUM for real experience, Container/Lambda Insights ready-made. Alarms act: autoscaling, SSM automation, tickets.

  • Composite alarm — the alarm of alarms: wakes you once, not twenty times
  • Logs Insights — log queries without ETL: diagnosis in minutes
  • Synthetics — canaries testing login and checkout every minute: the outage seen first
  • X-Ray — distributed tracing: the request followed across services
  • Metric filter — from log to metric to alarm: application errors counted
  • Cross-account — observability centralized across the organization: a single pane
04 · Numbers and lifecycle

The numbers that matter.

1 s
the resolution of high-resolution metrics
15 months
the retention of standard metrics
0 ETL
Logs Insights queries in place
24/7
the alarms in our NOC: the signal becomes a ticket
Monitoring is worth it if it wakes the right people: thresholds, composite alarms and runbooks — AWS observability inside Yocto Vision.
05 · Use cases

Where it really pays off.

Incident response

From symptom to cause with correlated logs and traces: MTTR cut in half.

Audit & compliance

Who turned that machine off? CloudTrail answers, always.

Cost & performance

The metrics that drive right-sizing: observability that pays for itself.

An unmanaged cloud is a cloud in the dark: curated alarms, preserved logs and everything inside our watch — just like on-prem.