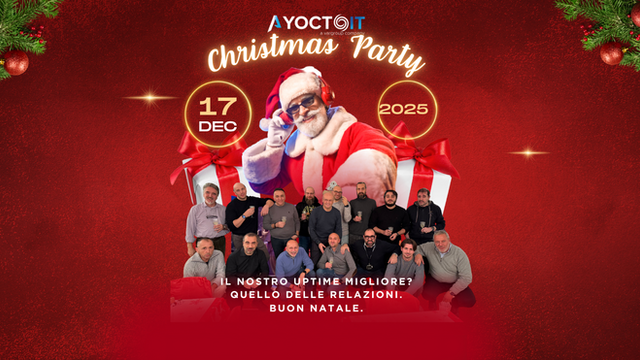
 A VARGROUP COMPANYA VARGROUP COMPANY
Gestiamo i sistemi mission-critical che fanno girare l'industria italiana: IBM i, IBM Power, cloud e cyber-resilience. Un solo partner, presidio 24/7/365, trasparenza totale — anche sui problemi.
Allora parli la nostra lingua madre: una profonda esperienza su Power e IBM i, 60+ certificazioni IBM.
Troppo. Per questo i nostri SLA partono da RTO < 1 ora e il ticket si apre in meno di un minuto.
Il 93% degli attacchi colpisce prima i backup. Noi costruiamo il punto che il ransomware non può toccare.
Il sistema che non si ferma. Multi-versione 7.3→7.6, PTF trimestrali, apertura a API REST, open source e AI.
L'hardware più resiliente: 99,9999% di disponibilità, sicurezza nel processore, multi-OS con migrazione live.
L'alternativa a VMware: container e VM insieme, uscita dal lock-in, compliance NIS2/DORA.
Il dato protetto, anche dal ransomware: Safeguarded Copy, FlashSystem NVMe, vault immutabile.
Sei tappe codificate, identiche su ogni cliente, ogni giorno. Ticket in <1 minuto, 99,9% di SLA rispettati, 100% tracciato.
Chi promette il 100% su tutto, mente. Noi mostriamo i numeri veri di Yocto Vision — anche quando non sono perfetti: è così che si costruisce la fiducia.
Dati aggiornati da Yocto Vision.
SAP HANA su IBM Power, DR ibrido in cloud, Safeguarded Copy, QRadar, migrazioni e refresh: ogni progetto è una storia documentata.
L'ERP mission-critical sulla piattaforma con il 99,9999% di disponibilità.
Il vault immutabile in produzione: il punto che il ransomware non tocca.
L'intera infrastruttura affidata a un solo partner, con NOC H24.
Case study, eventi, dietro le quinte: nessuno racconta l'IT in video come noi. Scorri e guarda.
Il 93% degli attacchi colpisce prima i backup. Tre livelli di resilienza, fino al vault immutabile.
▶ Guarda la storiaDalle 00:00 alle 23:30: sei momenti chiave ogni 24 ore. Voi dormite, noi vigiliamo.
▶ Guarda la storia200+ certificazioni su 16 vendor, 4 standard ISO. Specialisti certificati, non improvvisati.
▶ Guarda la storiaAbbiamo esternalizzato l'intera piattaforma come servizio. Per una banca fidarsi significa poter verificare: con YoctoIT verifichiamo ogni mese, numeri alla mano.
Sistemi e postazioni di un gruppo internazionale, seguiti come se fossero gli unici: il managed service ha tolto il rumore di fondo dal nostro IT.
SAP, backup e data center sotto un'unica regia: meno fornitori da coordinare, una sola responsabilità. Esattamente quello che cercavamo.
I nostri tecnici certificati analizzano la tua infrastruttura, individuano le criticità e ti consegnano un mitigation plan chiaro. Senza impegno.
YoctoIT nasce a Monza, nel cuore della Brianza industriale, e da qui coltiva soluzioni tecnologiche e sinergie con player locali e globali. Siamo una società del gruppo Vargroup: dietro ogni nostro servizio c'è l'esperienza di un grande gruppo sull'ecosistema IBM.
Crediamo in un'IT fatta di processi codificati e trasparenza totale: anche i problemi sono esposti, misurati e raccontati. È il modo più onesto di meritarsi la fiducia di chi ci affida i sistemi che non si possono fermare.

Run-book validati, sei tappe codificate, onboarding in 4–6 settimane: tutto è ripetibile e misurabile, su ogni cliente.
Yocto Vision mostra anche i problemi. Il ticket si chiude solo dopo verifica oggettiva, non sulla parola.
200+ certificazioni del team su 16 vendor e 4 standard ISO aziendali. Specialisti, non improvvisati.
Se i sistemi che non si fermano ti somigliano, c'è posto: cerchiamo persone curiose, precise e con voglia di crescere — dal NOC ai progetti enterprise.
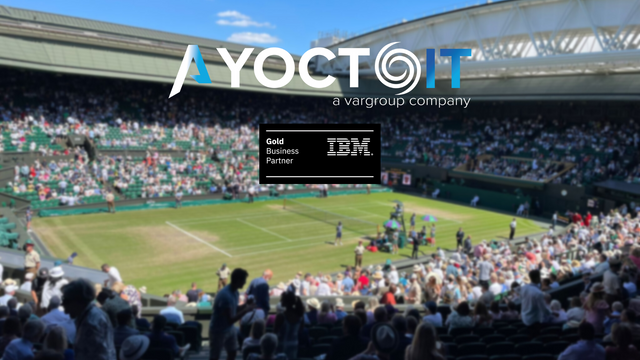
Le radici contano: sosteniamo lo sport e le eccellenze del nostro territorio, dal grande tennis di Villa Reale al futuro del tennis italiano.

Il grande tennis a Villa Reale, con YoctoIT al fianco.

Il nostro supporto al futuro del tennis italiano, con Francesco Passaro.
La nostra gara di golf, co-sponsorizzata da IBM.
Al fianco del calcio della nostra città.
Vieni a trovarci a Monza, o inizia dal Free Assessment: ti diciamo come sta la tua infrastruttura, gratis.
Il sistema che non si ferma, sulla piattaforma più resiliente. YoctoIT è parte di Vargroup: esperienza consolidata su Power e IBM i, 60+ certificazioni IBM, presidio managed H24.
OS, database e storage management integrati, security by design. Gestiamo IBM i 7.3, 7.4, 7.5 e 7.6 con allineamento PTF trimestrale. Le applicazioni RPG, COBOL e SQL convivono con API REST, open source, cloud e modelli AI: continuità decennale, zero vicoli ciechi.
Certificata da IBM, con aggiunta di CPU e memoria a caldo. Prestazioni per core ai vertici del mercato, alta densità LPAR/VM, sicurezza integrata nel processore e tre sistemi operativi — IBM i, AIX, Linux — su un'unica piattaforma, con migrazione live PowerVM.
certificazioni IBM del team.
Il know-how non si improvvisa.
Nel mondo dei container le applicazioni sono agili ed effimere, ma i dati restano persistenti e difficili da spostare: è la Data Gravity. IBM Storage Fusion nasce per eliminare questi limiti e rendere i dati nativi del cloud ibrido, esattamente come le applicazioni.
Molte soluzioni sono storage tradizionale adattato a Kubernetes. Fusion è progettata fin dall'origine per OpenShift: unifica accesso ai dati, protezione e performance in un'unica piattaforma.
Accesso ai dati ovunque — Edge, Core, Cloud — come se fossero locali, senza copie inutili. Niente "data tourism": una sola visione logica del dato grazie a IBM Storage Scale.
Backup e Disaster Recovery integrati nativamente, senza script complessi. Backup air-gapped e immutabili, efficaci anche contro il ransomware.
L'assenza del layer hypervisor riduce la latenza su rete e disco: ideale per AI, database e workload mission-critical ad alta intensità.
Con l'Erasure Coding (ECE), contro il 33% delle soluzioni basate su replica 3x.
Licensing bare metal per OpenShift basato su socket fisico: in molti scenari l'appliance intera costa meno del solo licensing su hypervisor.
Turnkey appliance: cluster OpenShift pronto in un giorno, gestione Day-2 da un single pane of glass, tutto via YAML nei flussi DevOps.
Backup air-gapped e immutabili con IBM Storage Protect Plus, su S3 o nastro. Metro-DR con replica sincrona fino a 150 km e tie-breaker su terzo sito, per la business continuity anche delle applicazioni monolitiche.
Fusion HCI — appliance IBM chiavi in mano (compute, network, storage), ideale per nuovi cluster.
Fusion SDS — software su hardware esistente o cloud (VMware, AWS, Azure, bare metal), per riusare gli investimenti.
YoctoIT è IBM Fusion Certified Partner e lavora a stretto contatto con IBM per progettare architetture OpenShift realmente pronte alla produzione.
Prenota una Fusion Discovery Session con gli architetti YoctoIT: scopri come accelerare il tuo ambiente OpenShift in modo sicuro, performante e sostenibile.
Managed services con NOC H24, cloud, network, refresh hardware e SAP Basis. Meno complessità, più continuità operativa.
NOC 24/7/365, monitoraggio attivo, Service Manager dedicato e report mensili brandizzati.
Architetture su misura su AWS, Azure, GCP e IBM Cloud: storage, backup, virtual desktop, container.
Progettazione, implementazione e verifica di reti sicure, VPN e segmentazione.
Analisi, pianificazione e migrazione: sistemi al passo con il business, senza fermi.
Installazione, monitoraggio, backup/recovery, upgrade e migrazioni dei tuoi ambienti SAP.
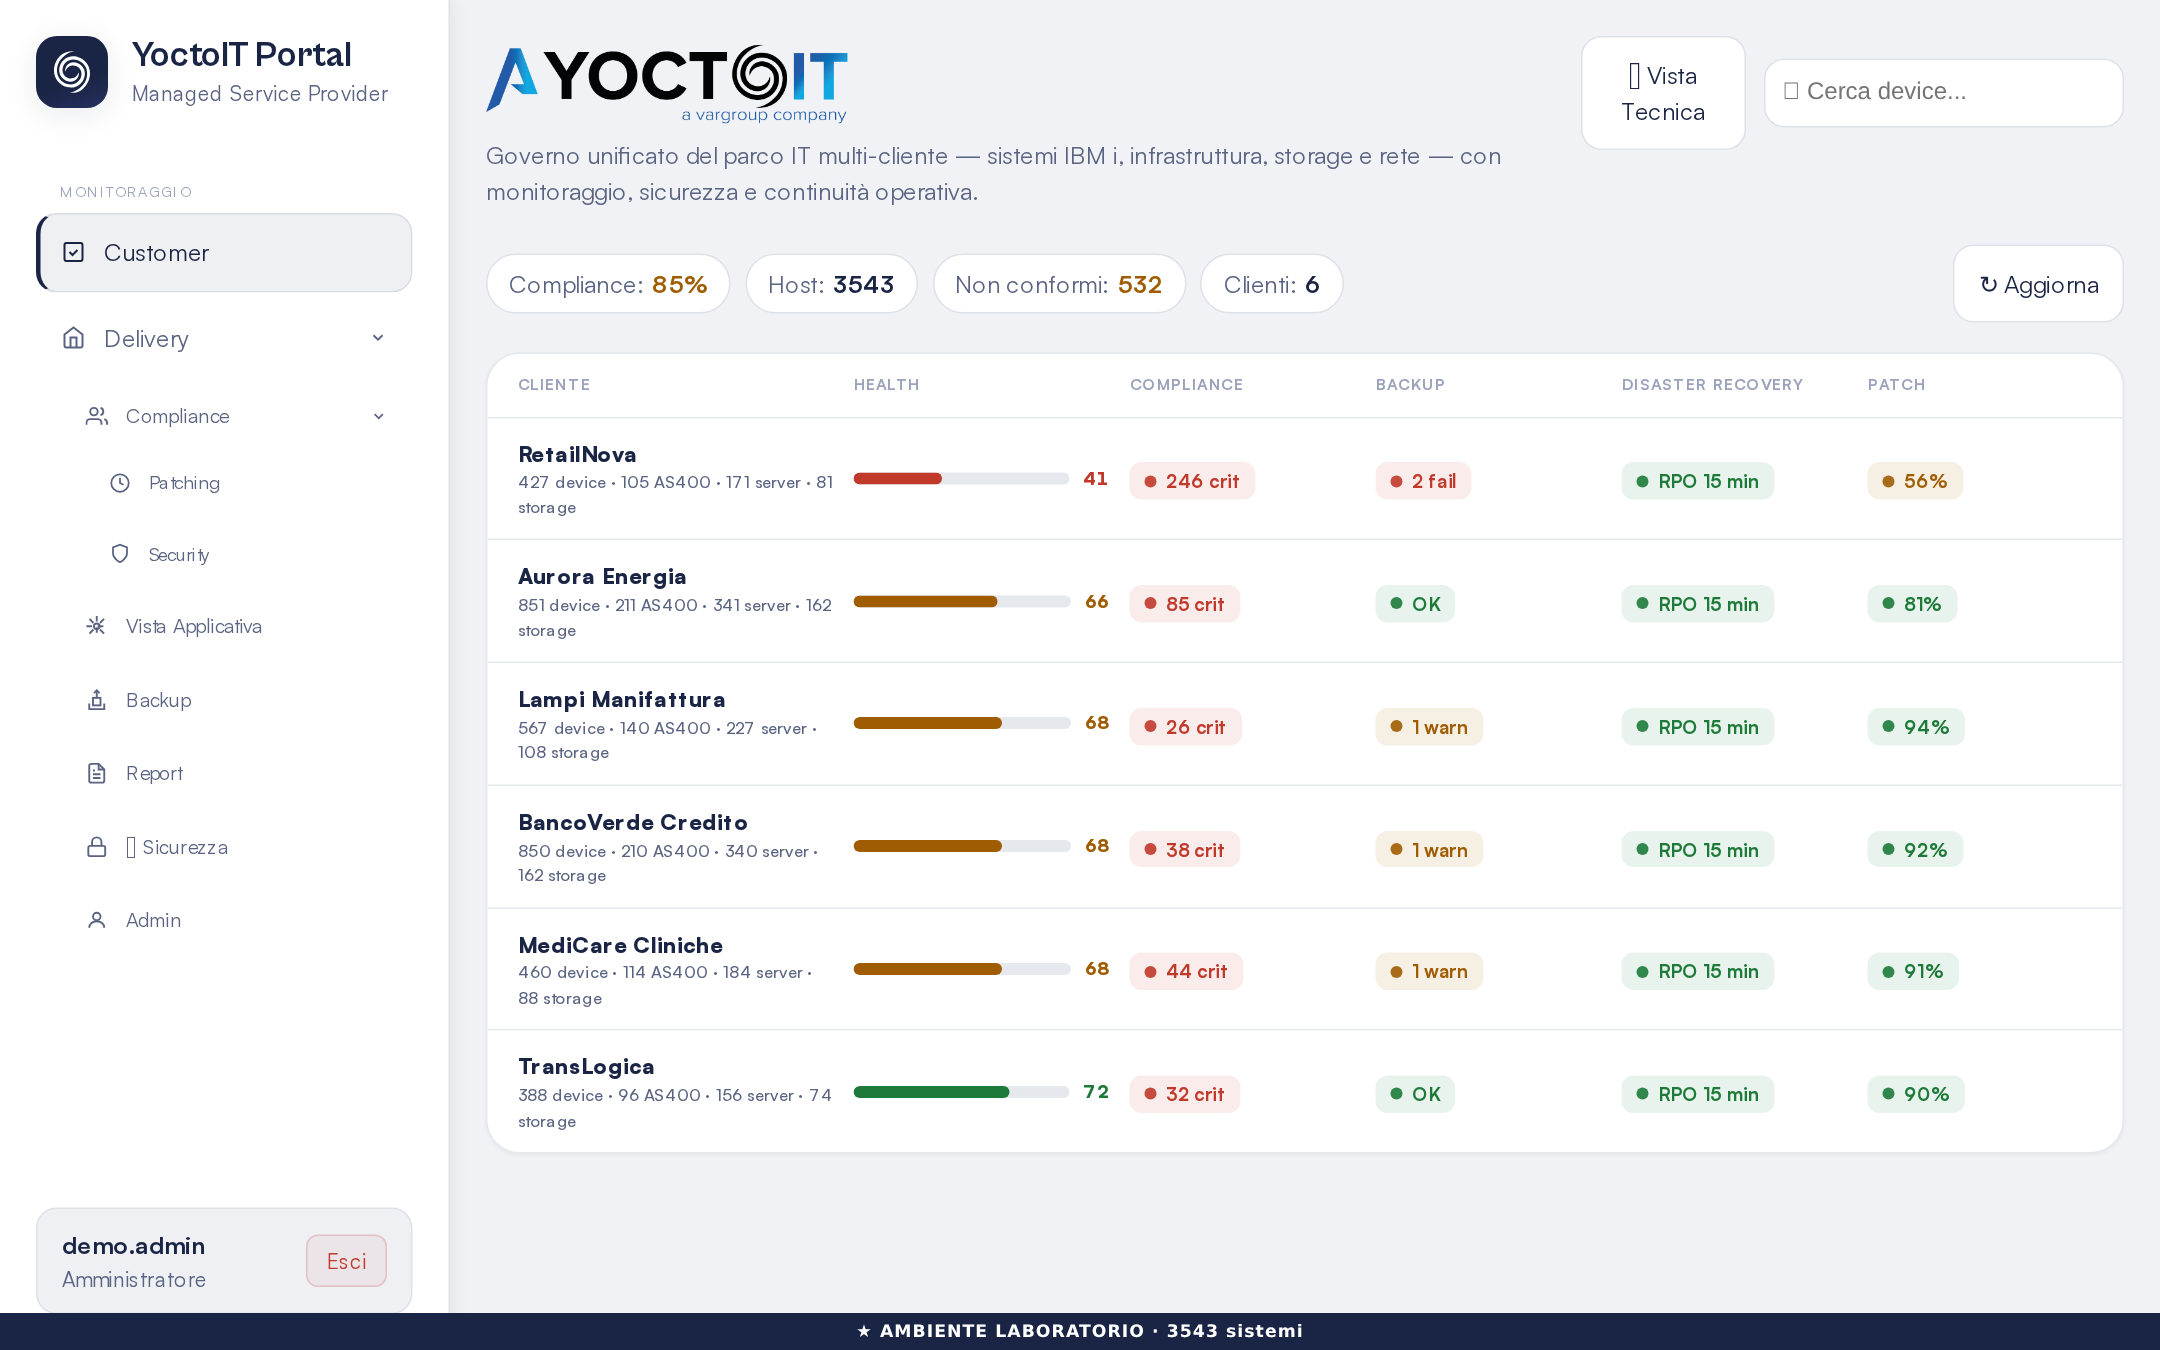
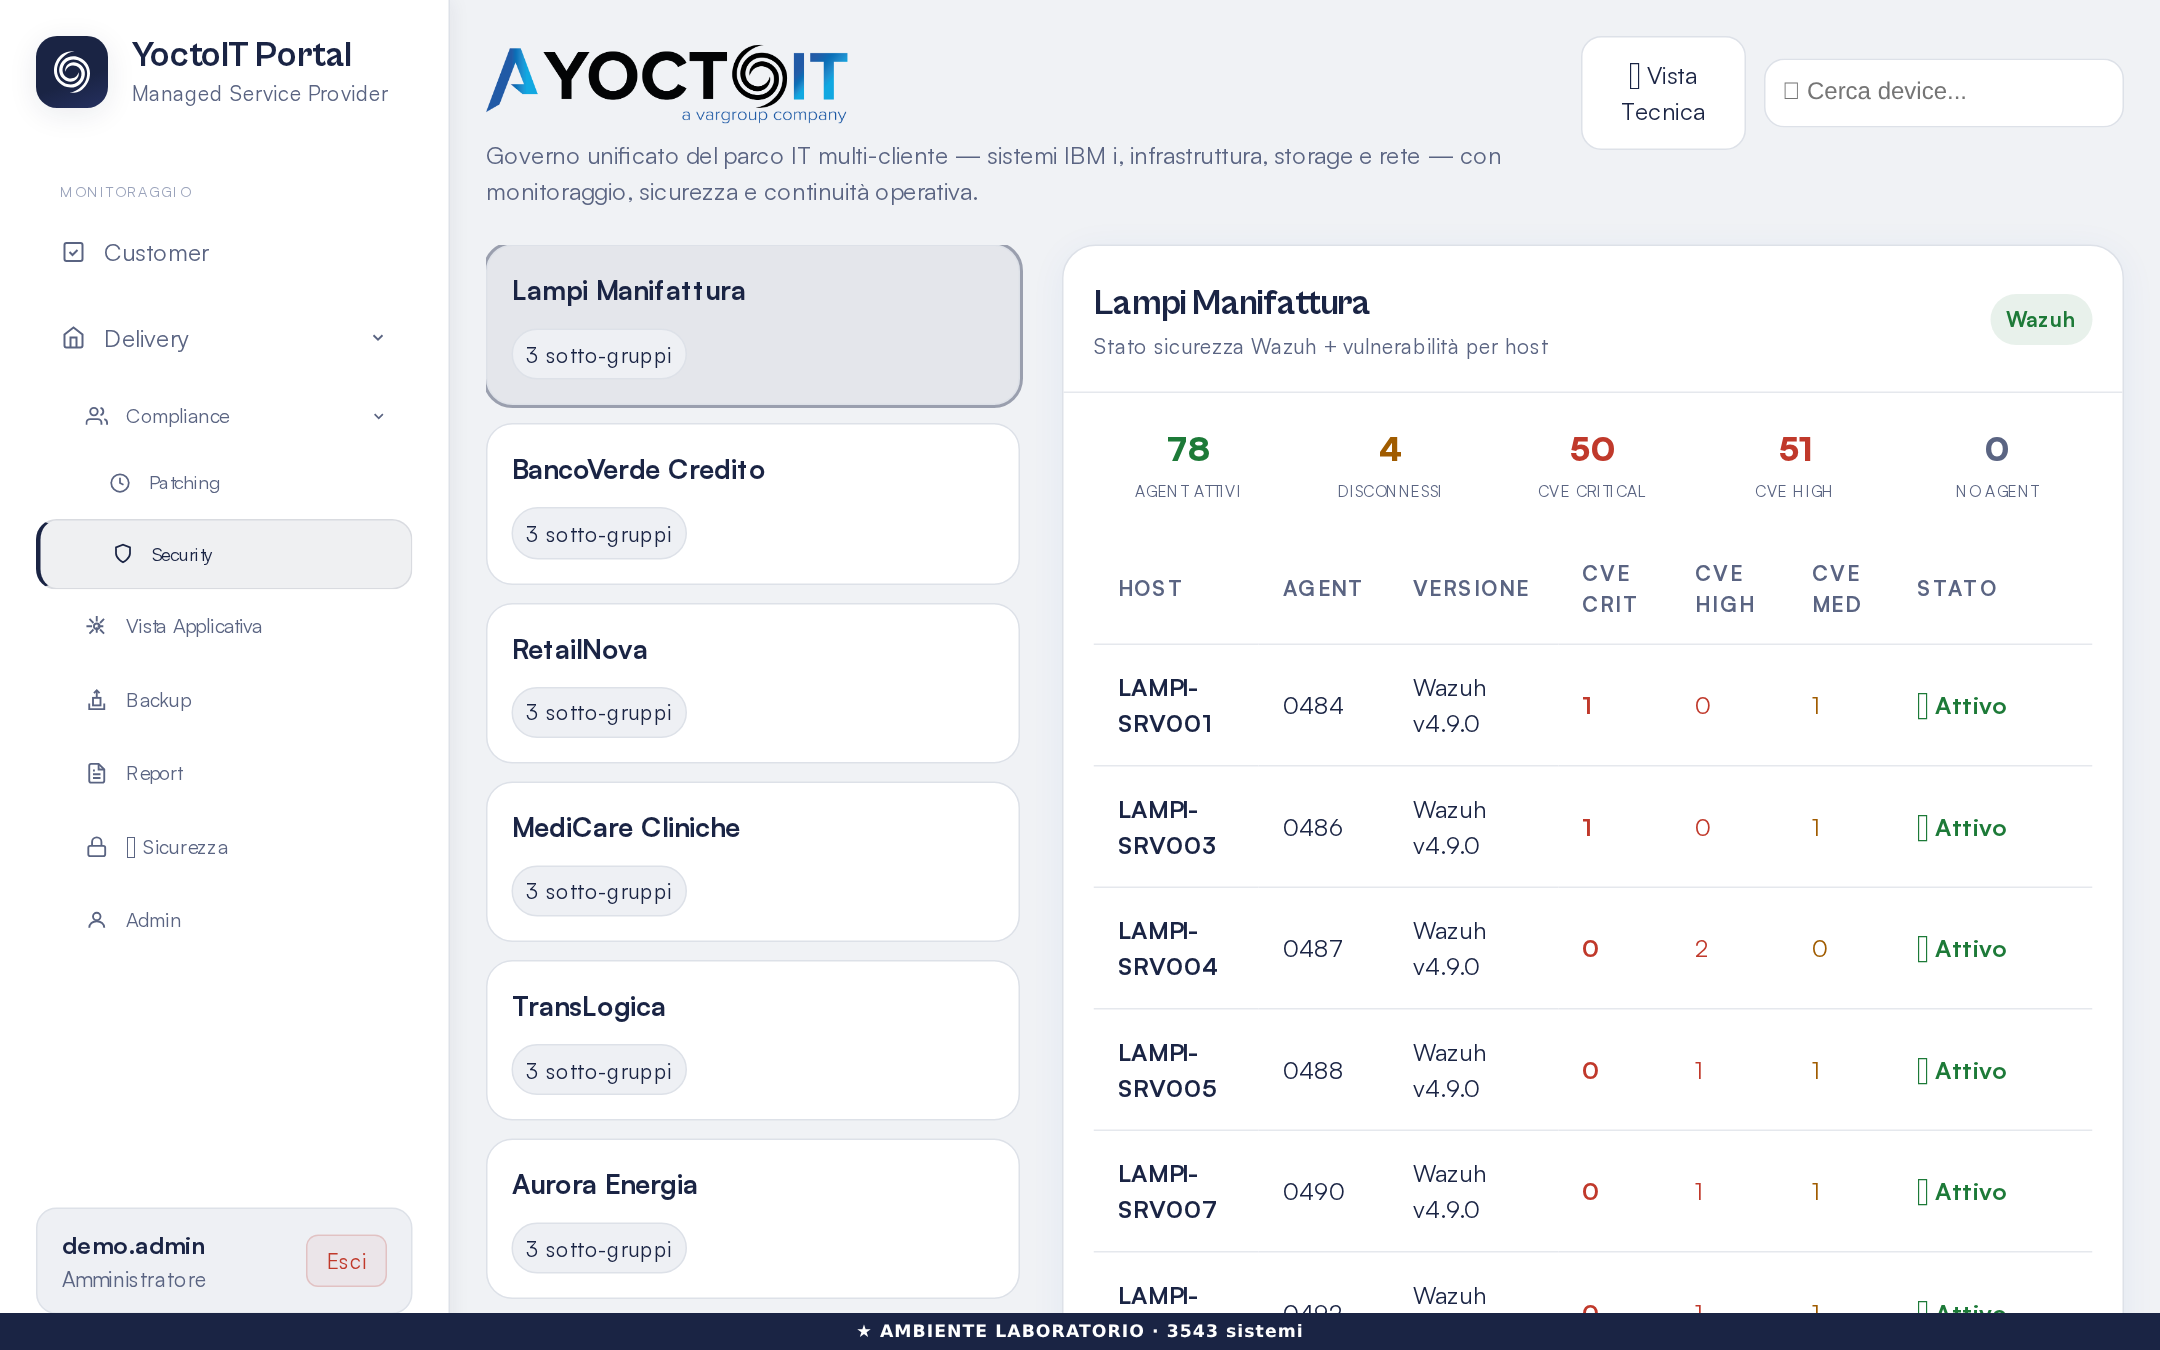
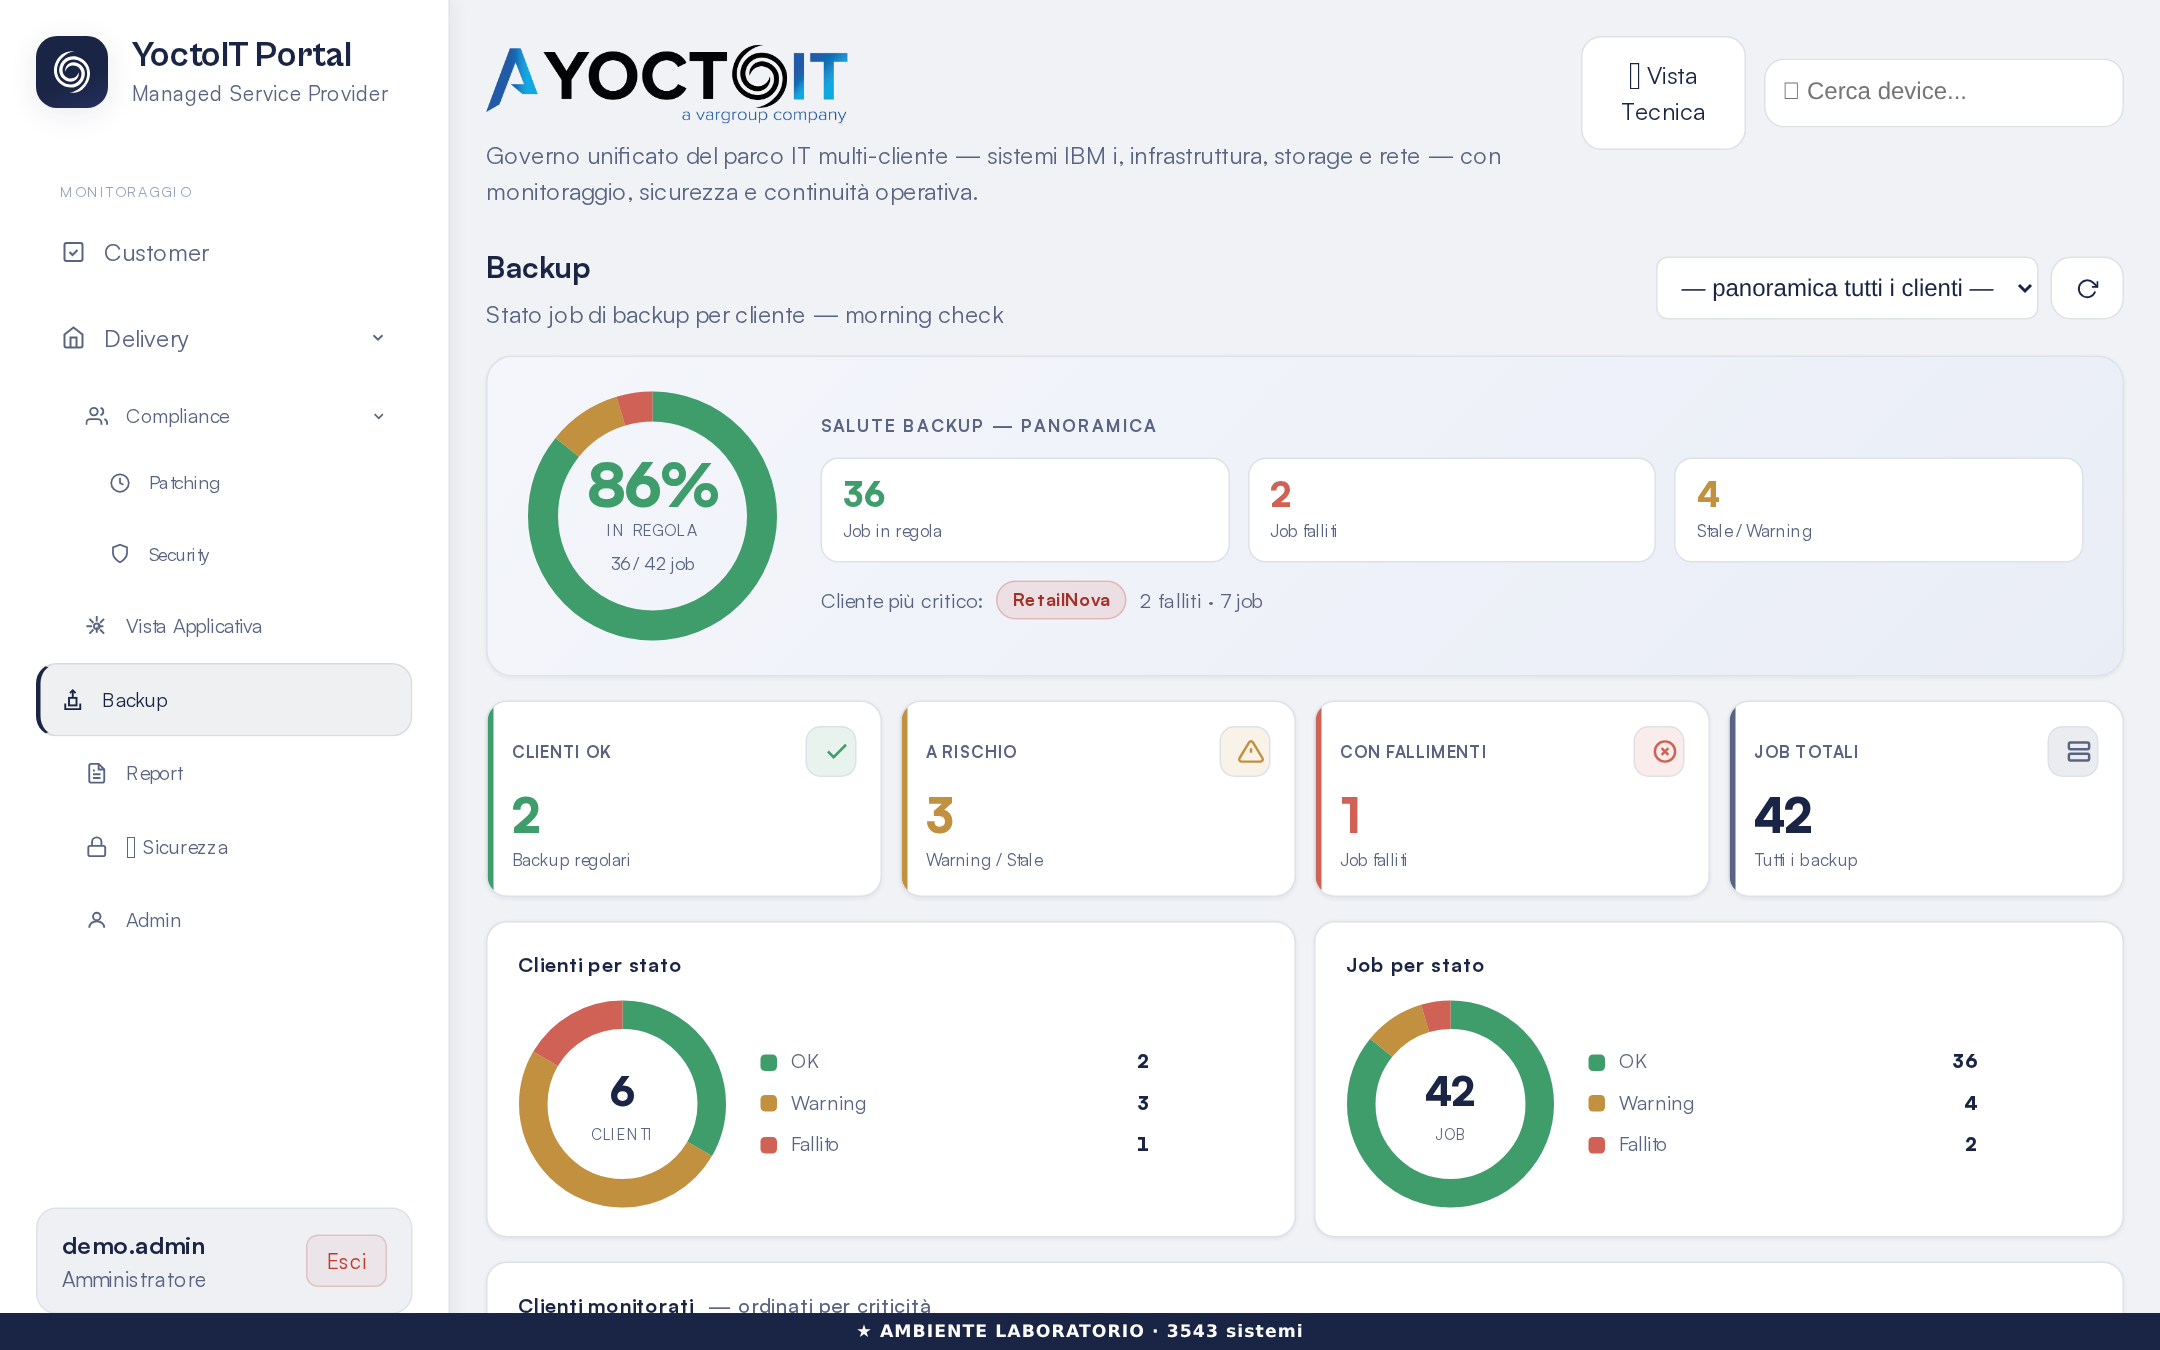
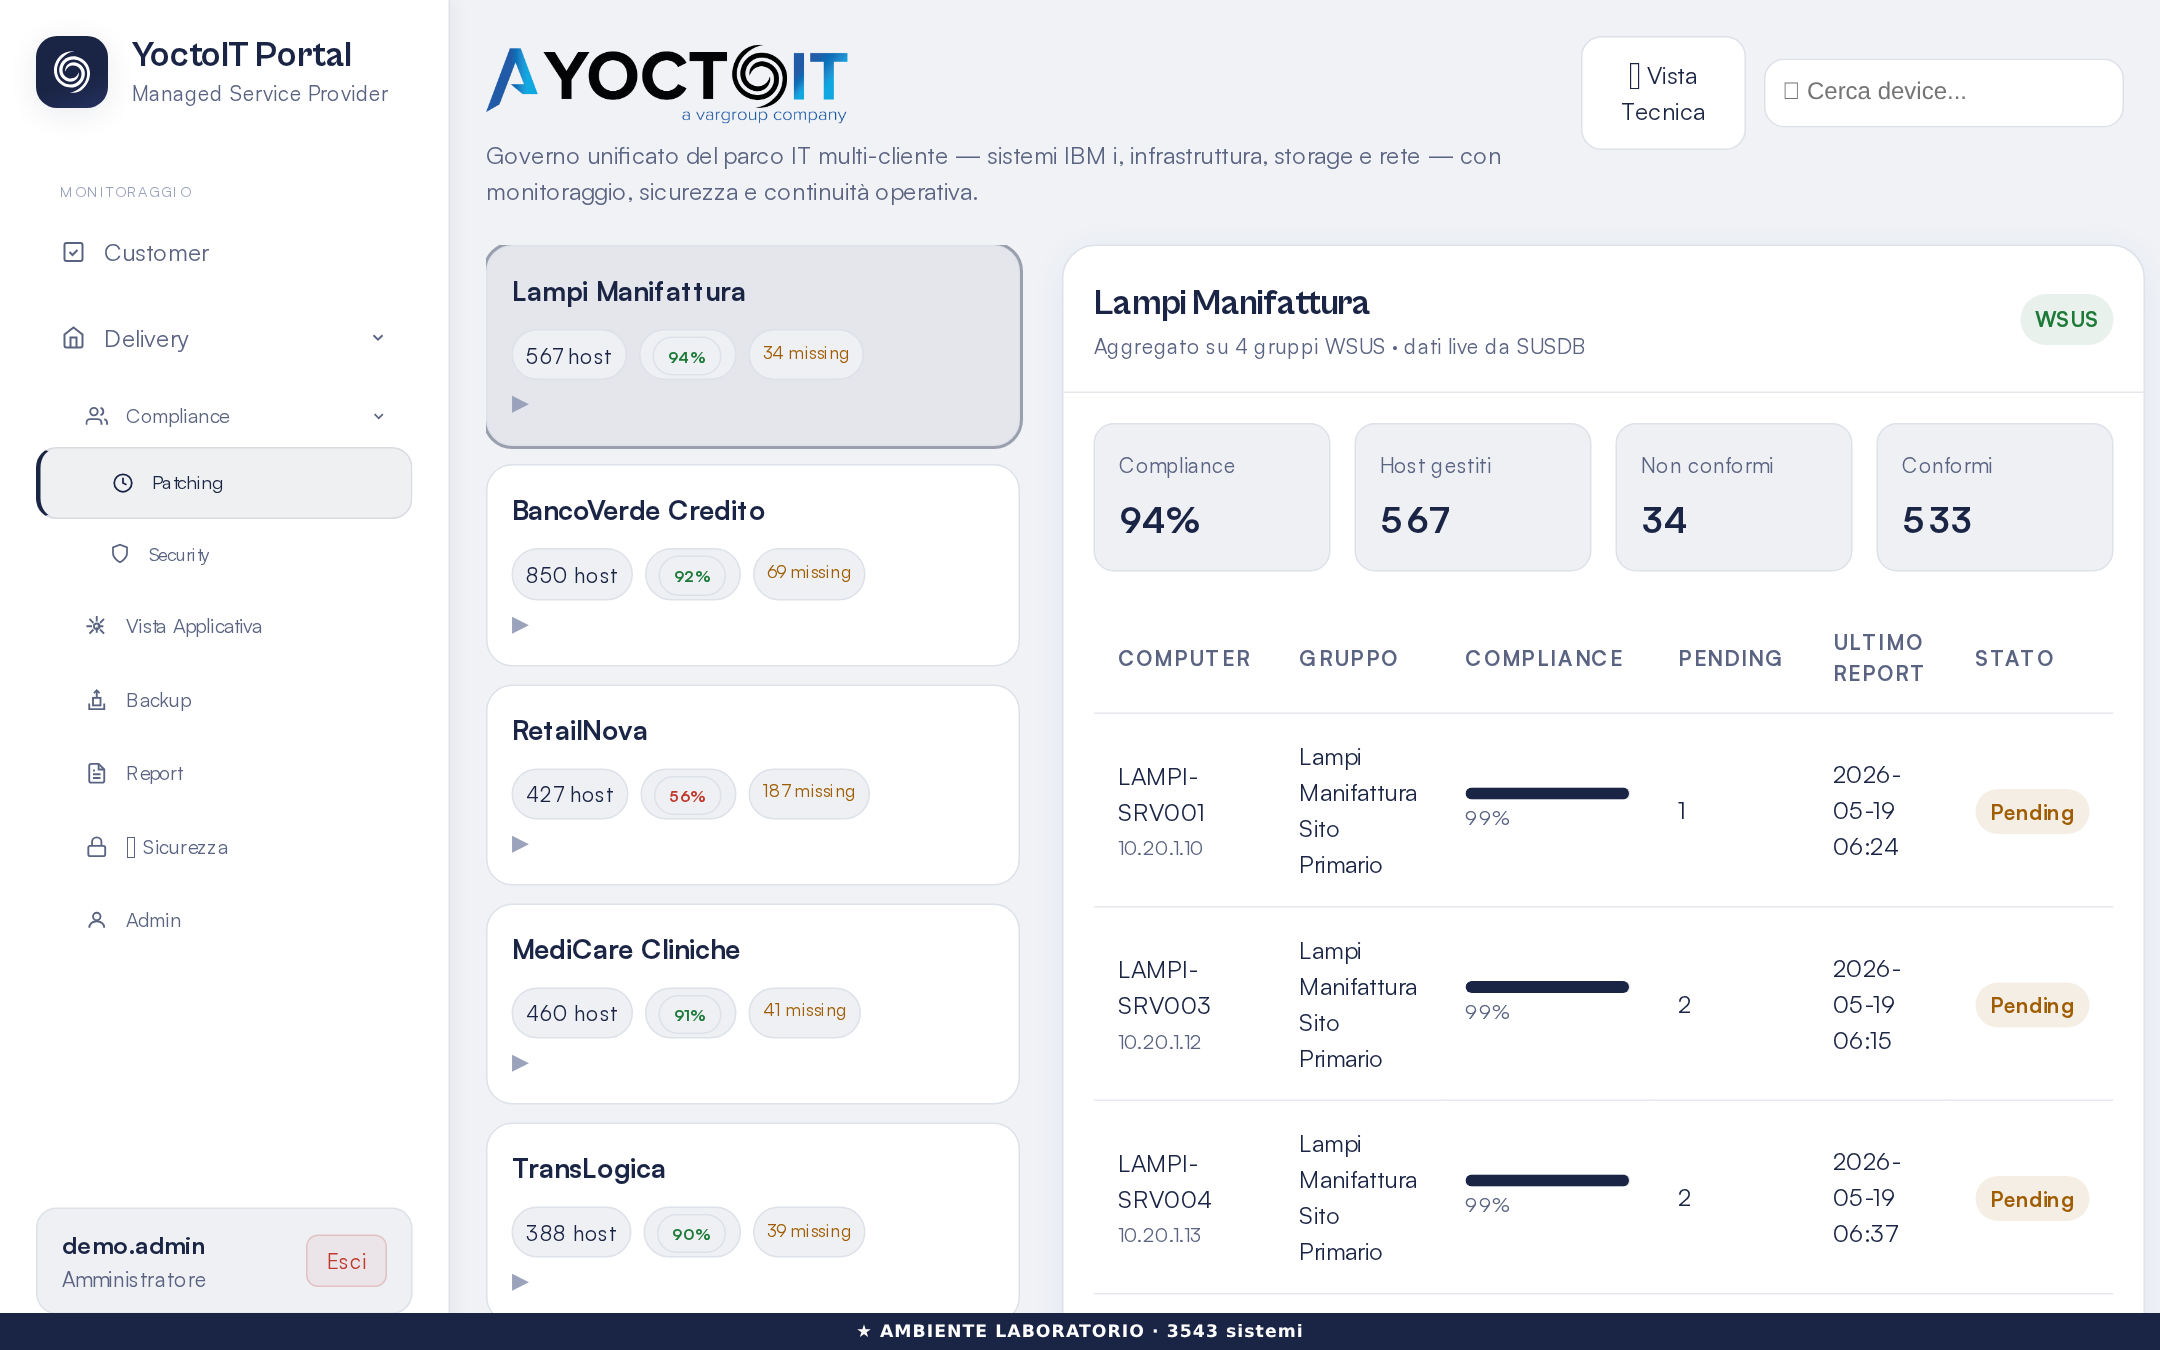
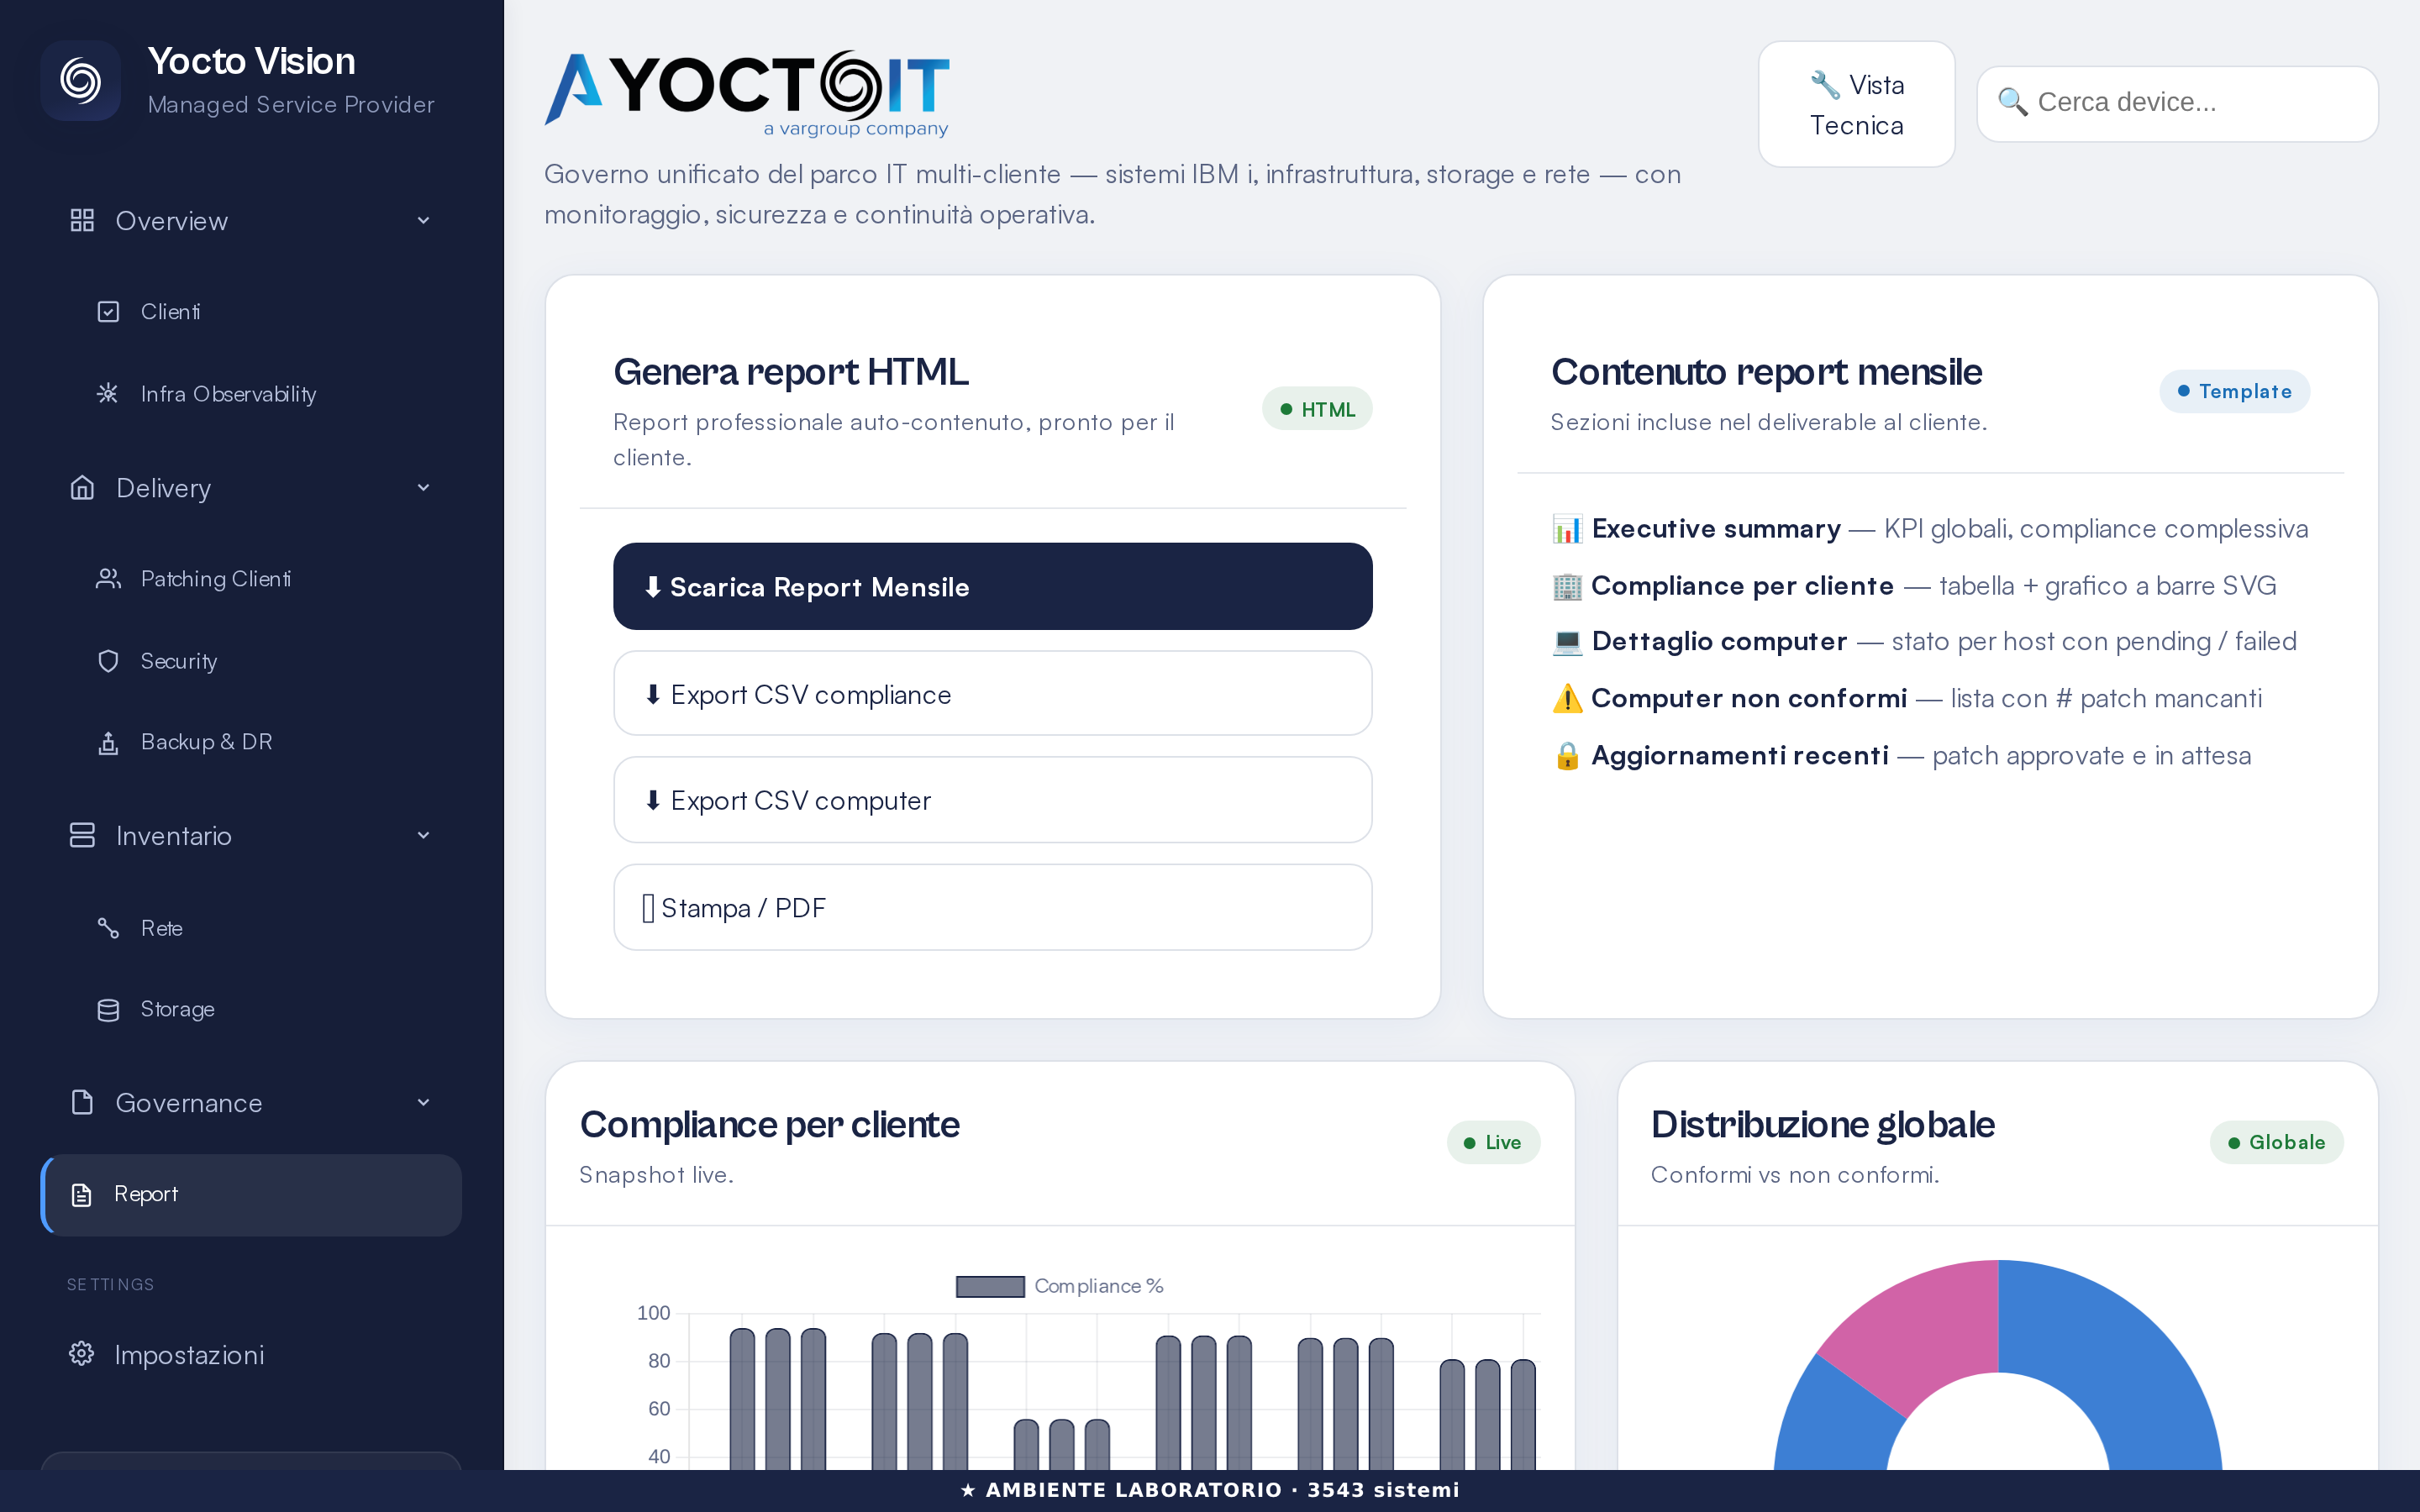
Yocto Vision, il portale YoctoIT: Health Score, compliance, patching, security, backup, CMDB e report SLA in un'unica dashboard.
Scopri Yocto Vision →Il ransomware moderno impara i pattern di backup e cripta anche le copie: il 93% degli attacchi colpisce prima i sistemi di backup. Un backup solo non basta più.
Cluster HA, repliche sincrone, snapshot ravvicinati nel data center primario.
SLA RTO < 1 ORA
Repliche asincrone su data center secondario distante. Se il primario va giù, il secondario sta in piedi.
SLA RPO 15 MIN
Safeguarded Copy: snapshot immutabili, air-gapped logicamente. Il punto che il ransomware non può toccare.
NIS2 · DORA
Yocto Vision è il nuovo portale YoctoIT: la console unica del servizio gestito — Health Score, compliance e patching, security, backup e DR, observability, CMDB e IPAM, governance e report SLA — live, multi-cliente, trasparente anche sui problemi.


Non un extra a listino: è il modo in cui rendiamo misurabile e trasparente quello che facciamo, ogni giorno.
Ti mostriamo Yocto Vision in una sessione guidata: Health Score, compliance, patching, security, backup, observability, CMDB e report SLA, sui casi reali e con un nostro specialista.
Oltre 90 progetti documentati: migrazioni, refresh, DR ibridi, sicurezza e managed services. «La forza di ogni azienda è il suo team: il lavoro di squadra ci ha portato a realizzare soluzioni su misura per modernizzare rapidamente l'infrastruttura dei nostri clienti.»
L'ERP mission-critical sulla piattaforma col 99,9999% di disponibilità: prestazioni senza compromessi.
Snapshot immutabili in produzione: il vault che il ransomware non può toccare.
SIEM enterprise e security intelligence per vedere le minacce prima che facciano danni.
L'intera infrastruttura affidata a un solo partner: NOC H24, SLA misurati, report mensili.
Disaster recovery ibrido on-prem + cloud: RPO 15 minuti, test periodici, zero sorprese.
Migrazione e ottimizzazione del parco: meno macchine, più prestazioni, costi sotto controllo.
Estensione SAN geografica per il disaster recovery tra data center distanti.
Migrazione pianificata in cloud pubblico con continuità operativa garantita.
Il desktop in cloud che ha tenuto operative le aziende durante l'emergenza Covid.
Non rivendiamo sigle: le certifichiamo. 200+ certificazioni attive del team su 16 vendor partner, più 4 standard ISO aziendali sui processi.
Clicca su un partner per vedere le certificazioni del team.
Sistema di gestione della qualità: processi certificati, ripetibili, misurati.
📄 Documento di attestazione
Sistema di gestione della sicurezza delle informazioni: la base di ogni servizio gestito.
📄 Documento di attestazione
Progettazione e sviluppo di servizi di hosting e cloud computing sicuri, con protezione dei dati personali.
📄 Documento di attestazioneGli eventi a cui partecipiamo coi nostri partner — IBM, Lenovo, AWS, Dell — e quelli che firmiamo noi: dal grande tennis a Monza all'AI Power Day. «Grazie a tutti questi eventi siamo un system integrator più completo.»
35 eventi dal 2019 a oggi. «Grazie a tutti questi eventi, siamo un system integrator più completo.»
Le radici contano. Da Monza sosteniamo lo sport e le eccellenze del territorio: dal grande tennis di Villa Reale (Monza Open) al futuro del tennis italiano con Francesco Passaro, dalla YoctoIT Golf Cup al Monza Calcio.
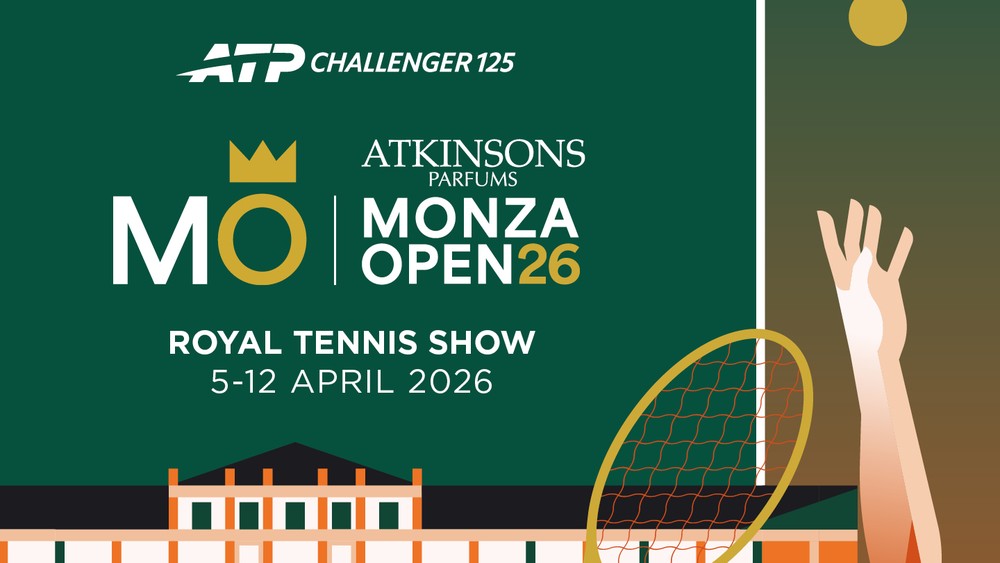
Di nuovo al fianco del grande tennis a Villa Reale: ATP Challenger 125.
Il grande tennis a Villa Reale, con YoctoIT al fianco: sport, eleganza e passione.
Il nostro supporto al futuro del tennis italiano, con Francesco Passaro.

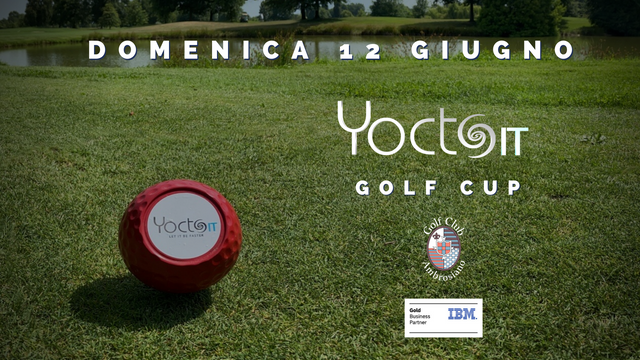
La nostra gara al Golf Club Ambrosiano: un'esperienza unica.
La seconda edizione, con un co-sponsor d'eccellenza: IBM.
Al fianco del calcio della nostra città.
Lo sport ci somiglia: squadra, costanza, risultati che si costruiscono ogni giorno. Per questo sosteniamo chi lo vive, dentro e fuori dal campo.
Le stesse storie che Otto racconta dal vivo ai nostri eventi: come lavoriamo, ogni giorno, su ogni cliente. Clicca una storia per guardare il video.
IBM i, Power, Fusion, Storage: l'ecosistema IBM end-to-end secondo YoctoIT, in 60 secondi.
▶ Guarda la storiaDal segnale anomalo al report al cliente: sei tappe codificate, identiche su tutti i clienti.
▶ Guarda la storiaTre livelli di resilienza per il dato che conta, fino al vault che il ransomware non può toccare.
▶ Guarda la storiaDalla firma al primo report di servizio: un percorso codificato, con un Service Manager dedicato.
▶ Guarda la storiaH24, 7/7, 365: sei momenti chiave che si ripetono ogni giorno. Voi dormite, noi vigiliamo.
▶ Guarda la storia200+ progetti, 100+ clienti, 15+ settori, 200+ certificazioni. Numeri reali.
▶ Guarda la storia4 standard ISO e 200+ certificazioni su 16 vendor: IBM, SAP, AWS, Red Hat, Azure e gli altri.
▶ Guarda la storiaI nostri tecnici certificati analizzano la tua infrastruttura, individuano e documentano le criticità, e ti consegnano un mitigation plan chiaro e prioritizzato.
Via Sempione 11, Monza
20900 MB — Italy
Informativa sul trattamento dei dati personali ai sensi del Regolamento (UE) 2016/679 — aggiornata al 20.01.2026.
Gentile Utente, nel corso della consultazione e dell’utilizzo del sito internet https://www.yoctoit.it/ (di seguito, “Sito”) verranno raccolti e trattati alcuni Suoi dati personali, così come definiti dall’ art. 4, par. 1 del Regolamento UE 2016/679 (di seguito, il “GDPR”).
La presente informativa descrive come raccogliamo, utilizziamo e proteggiamo i Suoi dati personali quando naviga sul nostro sito web, in conformità con l’articolo 13 del Regolamento Generale sulla Protezione dei Dati (“GDPR”). Rispettiamo la Sua privacy e la sicurezza dei Suoi dati personali; pertanto, le Sue informazioni personali saranno trattate esclusivamente per le finalità descritte in questo documento.
Il titolare del trattamento è YoctoIT S.r.l., con sede legale in Via Sempione 11, cap. 20900, Monza MB, e-mail: privacy@yoctoit.it (nel prosieguo, per brevità “YoctoIT” o il “Titolare del trattamento”).
Il titolare ha nominato, inoltre, un responsabile per la protezione dei dati (“Data Protection Officer” o “DPO”), come previsto dal GDPR, con compiti di sorveglianza, vigilanza e consulenza specialistica in ambito privacy contattabile per eventuale supporto al seguente indirizzo di posta elettronica: dpo@yoctoit.it
Il titolare tratta i dati personali di tutti gli utenti che usufruiscono dei servizi del sito web e di tutte le pagine ad esso collegate.
Quando naviga sul nostro sito web e durante l'utilizzo delle funzionalità ivi presenti, il Titolare tratta diverse categorie di dati personali, così raggruppate:
dati di navigazione (Tipo di dispositivo utilizzato, informazioni tecniche necessarie per stabilire la connessione, indirizzo IP, nome di dominio, URI, etc.). Tali dati potrebbero essere trattati anche attraverso cookies. A tal riguardo La invitiamo a leggere la specifica ai Cookie Policy presente sul Sito;
dati comuni, quali, a titolo esemplificativo e non esaustivo, dati anagrafici e di contatto (per esempio, nome, cognome, data di nascita, indirizzo, sesso, stato civile, codice fiscale, indirizzo e-mail, CV, ecc).
I Dati Personali saranno trattati dal Titolare, nell’ambito della propria attività, per le finalità di seguito indicate:
Consentire agli utenti di navigare sul nostro sito web nonché rilevare e prevenire frodi o abusi sul sito
I sistemi informatici del sito raccolgono alcuni dati personali la cui trasmissione è implicita nell’uso dei protocolli di comunicazione di Internet. Si tratta di informazioni che non sono raccolte per essere associate a te, ma che per loro stessa natura potrebbero, attraverso elaborazioni ed associazioni con dati detenuti da terzi, permettere di identificarti. Tra questi ci sono gli indirizzi IP o i nomi a dominio dei dispositivi utilizzati per connetterti al sito, gli indirizzi in notazione URI (Uniform Resource Identifier) delle risorse richieste, l’orario della richiesta, il metodo utilizzato nel sottoporre la richiesta al server, la dimensione del file ottenuto in risposta, il codice numerico indicante lo stato della risposta data dal server (buon fine, errore, ecc.) ed altri parametri relativi al tuo sistema operativo e ambiente informatico.
Questi dati vengono utilizzati al fine di ricavare informazioni statistiche anonime sull’uso del sito e per controllarne il corretto funzionamento, per permettere – vista l’architettura dei sistemi utilizzati – la corretta erogazione delle varie funzionalità da te richieste, per ragioni di sicurezza e di accertamento di responsabilità in caso di ipotetici reati informatici ai danni del sito o di terzi. a raccolta di questi dati è quello di consentirle di navigare e fruire del nostro sito.
La base giuridica per trattare i Suoi dati è il legittimo interesse - (Art. 6(1)(f) del Regolamento generale sulla protezione dei dati “GDPR”), ad amministrare e proteggere l'integrità del sito.
Se ci contatta utilizzando i recapiti indicati sul nostro sito, o in alternativa compilando i nostri form, tratteremo i Suoi dati personali per rispondere alle Sue richieste ed eventualmente per ricontattarla al fine di fornirle maggiori informazioni sui nostri servizi. La base giuridica per trattare i Suoi dati è l’esecuzione di misure precontrattuali adottate su richiesta dell’interessato (Art. 6(1)(b) del Regolamento generale sulla protezione dei dati “GDPR”).
Quando effettua una candidatura spontanea tramite il nostro sito, tratteremo i Suoi dati per valutare la candidatura sulla base delle informazioni da Lei fornite. La base giuridica per trattare i dati è l'esecuzione di misure precontrattuali adottate su richiesta dell'interessato - (Art. 6(1)(b) del Regolamento generale sulla protezione dei dati “GDPR”). Nella fase di ricerca e selezione del personale, il Titolare non ha di regola necessità di effettuare Trattamento di categorie particolari di dati personali (cd. Dati Sensibili). Pertanto, si chiede di inserire nel curriculum solo i dati necessari a valutare il profilo e di astenersi dall’indicare Dati Sensibili, salvo qualora si ritenga che le stesse siano necessarie per un miglior inquadramento della posizione, in particolare in relazione all’appartenenza a categorie protette. In questo caso, è necessario esprimere il consenso inserendo in calce al curriculum la seguente formula: “Avendo preso visione dell’informativa di YoctoIT S.r.l., presto il mio consenso al trattamento dei miei dati appartenenti a categorie particolari per le finalità di selezione ivi indicate”. In assenza di tale consenso, necessario a riconoscere anche i conseguenti benefici di Legge ove si appartenga a categorie protette, la candidatura non potrà essere valutata e le informazioni verranno immediatamente cancellate.
Qualora abbia acconsentito a cookie diversi da quelli puramente funzionali, possiamo anche raccogliere dati aggiuntivi relativi al Suo comportamento di navigazione (ad esempio, il tempo trascorso sul Sito, le pagine visitate, ecc.) - per ulteriori informazioni su questo argomento, si prega di consultare la nostra Cookie Policy.
Conserviamo i Suoi dati personali solo per il tempo necessario a soddisfare le finalità per cui sono stati raccolti, comprese finalità correlate all'adempimento di obblighi di legge, fiscali o contabili. I Suoi dati personali potrebbero essere conservati per un periodo più lungo in caso di reclamo o in caso di controversie collegate ai rapporti contrattuali intercorrenti.
Per determinare il periodo di conservazione per i dati personali, vengono considerati criteri quali:
le finalità del trattamento e la possibilità di raggiungere tali finalità con altri mezzi.
la quantità, la natura e la sensibilità dei dati trattati;
il rischio potenziale di danni alle persone, derivanti da un uso o da una divulgazione non autorizzata dei dati.
Il titolare non condividerà i Suoi dati personali con terzi, salvo che sia necessario per specifici trattamenti. In questi casi, i fornitori che trattano i Suoi dati come Responsabili del Trattamento (ai sensi dell'art. 28 del GDPR) lo faranno rispettando la riservatezza, la sicurezza e le istruzioni precise.
Altri soggetti, come autorità legali o organismi di controllo, potrebbero trattare i dati come titolari autonomi. Le persone autorizzate dal titolare o dai responsabili, inclusi dipendenti e collaboratori, tratteranno i dati seguendo le istruzioni del titolare e con obbligo di riservatezza.
I Suoi Dati Personali, di regola, non vengono trasferiti al di fuori dello Spazio Economico Europeo (“SEE”). Qualora si verificasse questa eventualità (ad esempio nel caso in cui si renda necessario condividere i suoi dati con destinatari situati extra SEE), le assicuriamo che il trattamento dei suoi Dati Personali, avverrà nel rispetto della normativa applicabile. Il trasferimento, dunque, sarà effettuato solo in presenza di adeguate garanzie, quali decisioni di adeguatezza, Standard Contractual Clauses approvate dalla Commissione Europea e, se necessario, misure di salvaguardia aggiuntive.
La informiamo che ha il diritto di:
Chiederci se i Suoi dati personali sono o meno in fase di trattamento e, in caso affermativo, richiederne l'accesso o richiedere delle copie dei Suoi dati personali. Può inoltre chiederci ulteriori informazioni relative alla presente Informativa (Diritto di accesso);
Chiederci di rettificare le informazioni che ritiene inaccurate. Ha anche il diritto di chiederci di completare le informazioni che ritiene incomplete (Diritto di rettifica);
Chiederci di cancellare i Suoi dati personali in determinate circostanze (Diritto all'oblio);
Opporsi, in determinate circostanze, al trattamento dei dati personali, per motivi connessi alla sua situazione specifica (Diritto di opposizione);
Il diritto a non essere sottoposto ad un processo decisionale automatizzato compresa la profilazione;
Revocare il consenso dato in qualsiasi momento (Diritto di revoca del consenso);
Ricevere i dati personali in un formato standardizzato nel caso in cui desideri trasferirli a un altro titolare del trattamento (Diritto alla portabilità dei dati);
Presentare un reclamo in qualsiasi momento all'Autorità Garante per la protezione dei dati personali, in caso di violazione dei diritti di protezione dei dati (Diritto di proporre reclamo ad un'autorità di controllo);
Chiederci di limitare il trattamento delle Sue informazioni in determinate circostanze (Diritto di limitazione del trattamento);
Le richieste vanno rivolte per iscritto al Titolare ovvero al DPO ai recapiti sopraindicati. Qualsiasi modifica o cancellazione o limitazione al trattamento effettuata su richiesta dell’Interessato, ovvero a seguito di revoca del consenso – a meno che ciò non sia impossibile o comporti uno sforzo sproporzionato – sarà comunicata dal Titolare del trattamento a ciascuno dei destinatari cui sono stati comunicati i Dati Personali.
La presente Informativa può essere soggetta a modifiche e revisioni. Tutti i dati personali trattati sono soggetti all'Informativa in vigore al momento della raccolta. Eventuali modifiche a questa Informativa verranno pubblicate su questa pagina e, se necessario, Le verranno comunicate. La invitiamo a consultare periodicamente la nostra Informativa in modo da essere sempre informato su come trattiamo i Suoi dati personali.
Data di ultimo aggiornamento 20/01/2026
Parte di questo sito utilizza i cookie, che sono stringhe di testo che i siti visitati dall’utente memorizzano sull’hard disk del computer o su qualsiasi dispositivo utilizzato per accedere ad Internet (smartphone, tablet), per poi essere ritrasmessi agli stessi siti nel corso dei successivi accessi ad Internet dell’utente stesso.
I cookie possono essere memorizzati in modo permanente sul computer dell’utente ed avere una durata variabile (c.d. cookie persistenti), ma possono anche svanire con la chiusura del browser o avere una durata limitata (c.d. cookie di sessione).
I cookie possono essere istallati dal sito che si sta visitando (c.d. cookie di prima parte) o possono essere istallati da altri siti web (c.d. cookie di terze parti) e sono usati per eseguire autenticazioni informatiche, monitoraggio di sessioni e memorizzazione di informazioni riguardanti le attività degli utenti che accedono ad un sito.
In base alla finalità di utilizzo sono classificati in:
Cookie di navigazione e funzionalità: utilizzati rispettivamente per finalità di autenticazione e di miglioramento dell’esperienza utente
Cookie analitici: utilizzati dal gestore del sito per raccogliere informazioni sugli utenti che visitano il sito stesso
Cookie di profilazione: utilizzati con finalità pubblicitarie per l’invio di messaggi in linea con le preferenze degli utenti raccolte durante la navigazione in rete.
Cookie sociali: utilizzati per consentire l’interazione con i social network
In base alla normativa vigente in Italia non è richiesta una esplicita accettazione dei cookie da parte dell'utente se questi sono identificati come "tecnici" o “analitici” di prima e terza parte (se sono adottati strumenti che riducono il potere identificativo dei cookie e la terza parte non incrocia le informazioni raccolte con altre di cui già dispone), cioè finalizzati esclusivamente alla trasmissione di una comunicazione su una rete di comunicazione elettronica.
Come da indicazioni del Garante per la protezione dei dati (cfr. Provvedimento Generale "Individuazione delle modalità semplificate per l'informativa e l'acquisizione del consenso per l'uso dei cookie - 8 maggio 2014") sono da considerare tecnici:
I cookie analitici laddove utilizzati direttamente dal gestore del sito per raccogliere informazioni, in forma aggregata e anonima, sul numero degli utenti e su come questi visitano il sito stesso
i cookie di navigazione e funzionalità.
Puoi bloccare l’accettazione di cookies da parte del browser di navigazione. Tuttavia, questa operazione potrebbe impedire ad alcune funzioni delle pagine web di essere eseguite correttamente.
Ti riportiamo di seguito le modalità di disabilitazione dei cookie offerte dai principali browser:
Internet Explorer
Chrome
Firefox
Safari
Opera
Il presente Sito utilizza soltanto cookie tecnici di navigazione e funzionalità e cookie analitici di prima e terza parte.
Di seguito si riporta l’elenco dei cookie tecnici ed analitici di prima parte utilizzati in questo sito web:
Ultimo aggiornamento 21/01/2026
Il sito non utilizza cookie di profilazione né cookie di tracciamento di terze parti.
Per il corretto funzionamento possono essere impiegate esclusivamente memorizzazioni tecniche locali nel browser (localStorage e sessionStorage), prive di identificatori e di finalità di tracciamento, che non comportano trasmissione di dati a terzi.
I caratteri tipografici del sito sono caricati da fornitori esterni (Google Fonts, Fontshare): in tale occasione i fornitori possono trattare i dati di navigazione descritti al paragrafo "Categorie dei dati trattati". I collegamenti a contenuti esterni (ad esempio video su YouTube) si aprono sulle piattaforme dei rispettivi fornitori, alle cui informative si rinvia.
Certificazioni attive del team YoctoIT. Il totale sul portfolio è di 200+ certificazioni su 16 vendor partner.